Back-Projection Analysis of Earthquakes
|
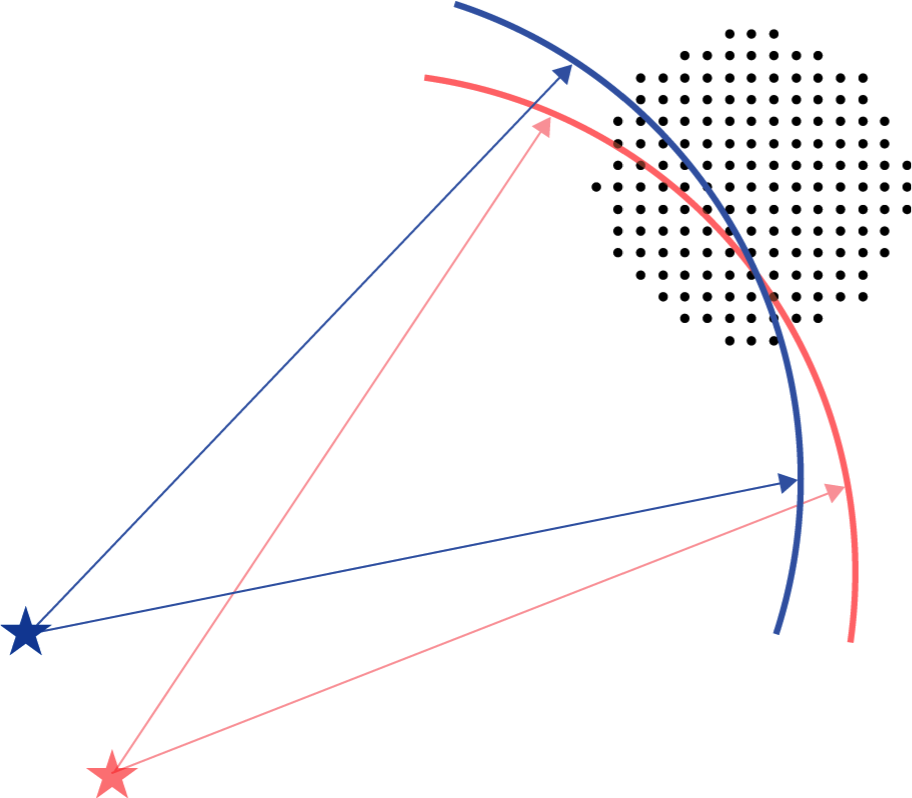
Back-projection technique takes advantage of the dense array of seismometers that are available around the world such as the Transportable Array in the United States and Hi-net array in Japan. The wavefront observed by the array is collapsed back in space and time (back-projected) to the target region to determine the timing and location of the energy source that generated the seismic waves. If an earthquake has large enough spatial and temporal extent, the rupture propagation can be imaged with great detail using this technique. |
 |
Rupture Properties of Giant Earthquakes
Some of the large earthquakes we have analyzed using the back-projection technique are listed below with brief summary (other earthquakes can be found in published papers). There are earthquakes for which we have separate web pages showing preliminary or summary of results.
 Rupture propagation animation of the 2004 Sumatra-Andaman earthquake as imaged by the Hi-net array. |
The rupture properties of the largest earthquake in the last 40 years are imaged using data from the Japanese Hi-net data, showing nearly 1300 km of rupture extent that happens over 9 minutes. Unlike the 2004 Mw 9.3 earthquake that occurred directly northwest, this earthquake shows bilateral rupture propagation. The initial propagation is to the northwest towards the 2004 rupture region, but later reverses direction and propagates to the southeast. The larger earthquake occurs first, releasing seismic energy in an area mostly northwest of the epicentre. The second event that occurs about a day later, breaks through two patches that are northwest of the rupture region of the first event, and has very little overlap. The large outer-rise normal earthquake consists of two events that are not continuous. The initial energy release lasts for a short period with propagation in the northwest direction. The second subevent starts slightly northwest of the termination of the first subevent and propagates back towards southeastern direction. This bilateral event has been analyzed at different frequencies, and shows systematic high-frequency energy radiation in front of lower-frequency energy. It also shows co-seismic gap which is later filled in by the March 25, 2012 Mw 7.1 earthquake. This earthquake is by far the most complicated, showing different rupture directions and frequency dependence. The foreshock, a magnitude 7.3 earthquake on March 09, 2012, has also been analyzed, showing rupture region to the northwest of the epicenter of the mainshock. This pair of strike-slip earthquakes show very different rupture directions with the smaller event having mostly north-south rupture while the larger event is composed of multiple subevents with dominant southeast-northwest rupture propagation. |
Earthquake Detection
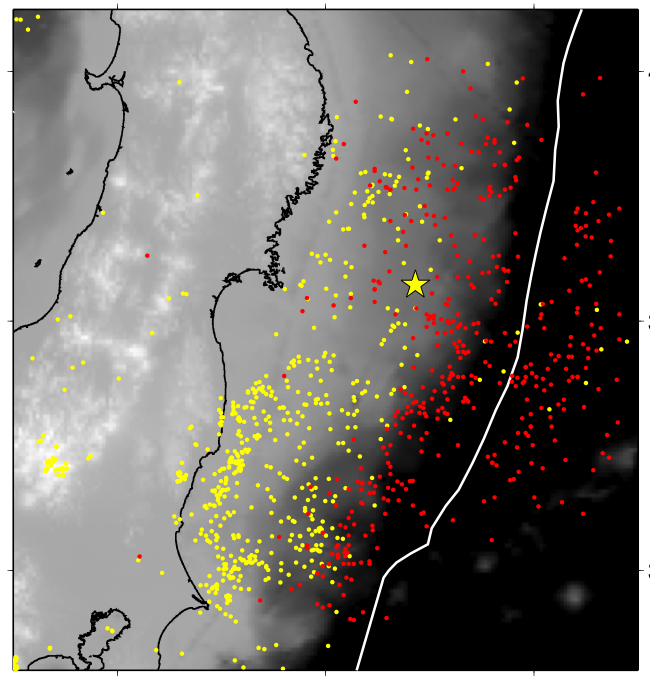 |
Even though the rupture extent and duration are not large enough to image details, smaller earthquakes can be detected using back-projection analysis and seismic arrays. Application of the approach to times immediately after the 2011 Japan earthquake shows that earthquakes as small as magnitude 4's can be detected using seismic networks in North America (with main contribution from the USArray Transportable Array). Some of these earthquakes are not listed in the local (i.e., Japan Meteorological Agency) or global (e.g., National Earthquake Information Center) catalogues. More information about how to hide these earthquakes from dense local monitoring network (e.g., Hi-net array in Japan) can be found here.
|
Deep Earthquakes
|
For deep (depth > 100 km) earthquakes, the depth phases can be combined with the direct phase to achieve good resolution in depth of the rupture. Our analysis of 22 intermediate-depth (100-400 km depth) earthquakes with magnitudes above 6.5 and at teleseismic P distances from the Japanese Hi-net array show that many of these earthquakes rupture on a nearly horizontal plane (very little depth extent). Furthermore, a good fraction of these earthquakes (8 out of 22 earthquakes) consist of multiple sub-horizontal rupture planes that are separated in depth. The timing and depth separation of these events suggest that the secondary plane is dynamically triggered by P waves. We propose a new mechanism to explain these observations that includes activation of pre-existing zones of weakness, hydrous minerals, and focusing of water due to grain-size differences. |
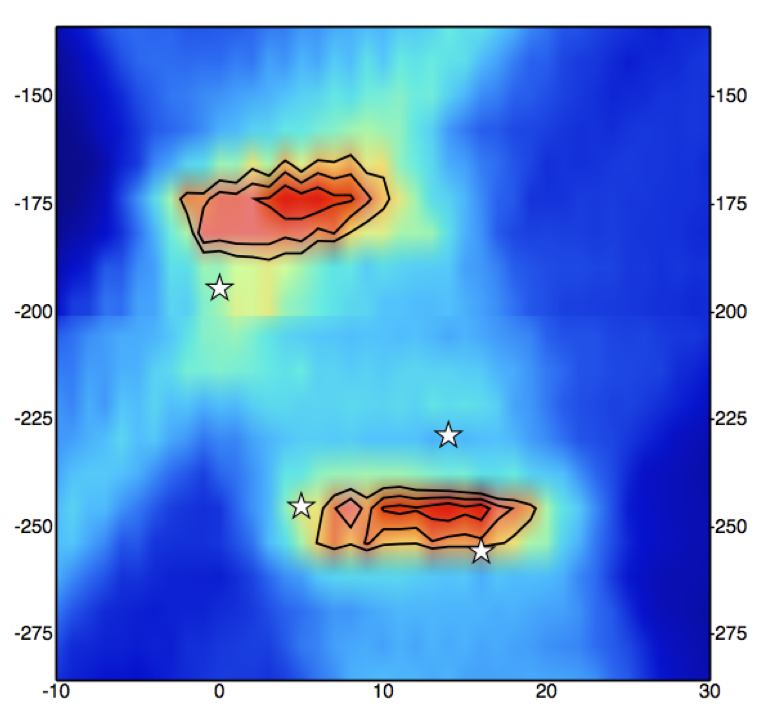 Back-projection result of the Mw 7.4 Hindu Kush Earthquake showing the rupture location as a function of depth (y-axis) and time (x-axis). |
Publications
Kiser, E., & Ishii, M., 2013.
Hidden aftershocks of the 2011 Mw~9.0 Tohoku, Japan earthquake imaged with the backprojection method.
J. Geophys. Res 118, 5564-5576, doi:10.1002/2013JB010158.
Kiser, E., & Ishii, M., 2013.
The 2010 Maule, Chile coseismic gap and its relationship to the Mw 7.1 March 25, 2012 earthquake.
Bull. Seismol. Soc. Am. 103, 1148--1153, dio:10.1785/0120120209.
Ishii, M., Kiser, E., \ Geist, E.L., 2013.
Mw 8.6 Sumatran earthquake of April 11, 2012: Rare seaward expression of oblique subduction.
Geology 41, 319-322, doi:101130/G33783.1.
Kiser, E., & Ishii, M., 2012.
The March 11, 2011 Tohoku-oki earthquake and cascading failure of the plate interface.
Geophys. Res. Lett. 39, L00G25, doi:10.1029/2012GL051170.
Kiser, E., & Ishii, M., 2012.
Combining seismic arrays to image the high-frequency characteristics of large earthquakes.
Geophys. J. Int. 188, 1117-1128.
Kiser, E., & Ishii, M., 2011.
Back-projection results for the Mw 9.0 March 11, 2011 Tohoku, Japan earthquake.
IRIS Annual Report, 10-11
Ishii, M., 2011.
High-frequency rupture properties of the Mw 9.0 Off-the-Pacific-Coast-of-Tohoku earthquake.
Earth, Planets, Space 63, 609-614.
Kennett, B.L.N, Gorbatov, A., & Kiser, E., 2011.
Structural controls on the Mw 9.0 2011 Offshore-Tohoku earthquake.
Earth Planet. Sci. Lett. 310, 462-467.
Kiser, E., Ishii, M., Langmuir, C.H., Shearer, P.M., & Hirose, H., 2011.
Insights into the mechanism of intermediate-depth earthquakes from source properties as imaged by back-projectin of multiple seismic phases.
J. Geophys. Res. 116, B06310, doi:10.1029/2010JB007831.
Kiser, E., & Ishii, M., 2011.
The 2010 Mw 8.8 Chile earthquake: Triggering on multiple segments and frequency-dependent rupture behavior.
Geophys. Res. Lett. 38, L07301, doi:10.1029/2011GL047140.
Kiser, E., & Ishii, M., 2010.
Modeling the 2010 Chile earthquake rupture with USArray.
inSights, the EarthScope Newsletter, fall 2010, 2.
Ishii, M., Shearer, P.M., Houston, H., & Vidale, J.E., 2007.
Teleseismic P wave imaging of the 26 December 2004 Sumatra-Andaman and 28 March 2005 Sumatra earthquake ruptures using the Hi-net array.
J. Geophys. Res. 112, B11307, doi:10.1029/2006JB004700.
Walker, K., Ishii, M., & Shearer, P.M., 2005.
Rupture details of the 28 March 2005 Sumatra Mw 8.6 earthquake imaged with teleseismic P waves.
Geophys. Res. Lett. 32, L24303, doi:10.1029/2005GL024395.
Ishii, M., Shearer, P.M., Houston, H., & Vidale, J.E., 2005.
Extent, duration and speed of the 2004 Sumatra-Andaman earthquake imaged by the Hi-net array.
Nature 435, 933-936.