Preliminary Rupture Modelling of the February 27, 2010 Chilean Earthquake using the Hi-net and USArray Transportable Arrays
Point of contact: Eric Kiser
We apply the back-projection technique to Hi-net and USArray Transportable Array data to image the rupture properties of the February 27, 2010 Chilean earthquake. Combining results from two arrays at different azimuths relative to the source leads to better resolution of the rupture process. The Transportable Array stations are located at distances between about 65 and 95 degrees, and the P waveforms of the Transportable Array data filtered to Hi-net frequencies are aligned and back-projected. On the other hand, the Hi-net stations are at distances between 150 and 165 degrees. In order to back-project the PKIKP phase and avoid complications from the outer-core phases BC and AB, we use a subset of the data at distances between 155 and 165 degrees. The back-projected stacks of P and PKIKP waveforms are integrated to produce results below.
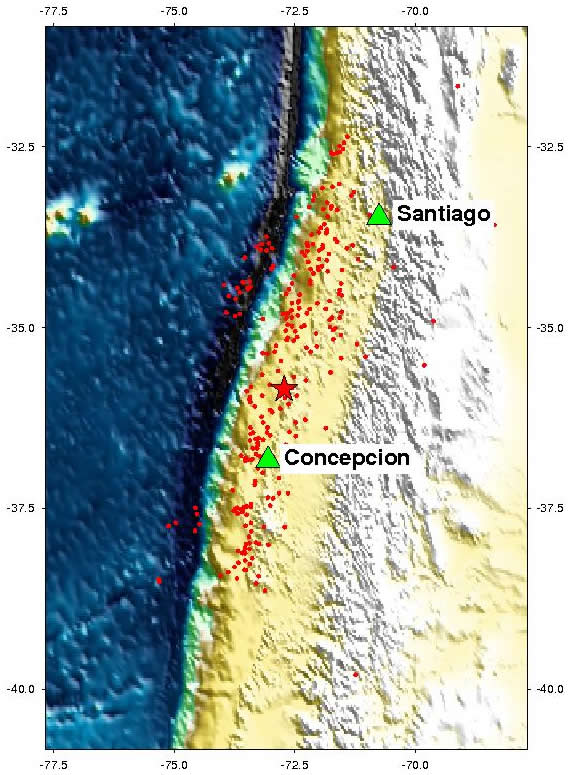
Rupture PropagationPropagation of the rupture front as imaged by the Hi-Net and USArray Transportable arrays (right). The plotted quantity is the squared amplitude of the back-projected stacks, i.e., proportional to released energy at high frequencies. Warmer colours indicate higher relative energy release, the red star shows the epicentral location, and white dots are aftershock locations. Time with respect to the hypocentral time is shown at the top left corner. The animation shows bilateral rupture with the main rupture in the initial few seconds occurring to the south of the epicenter, but most of the propagation and energy release occurs to the north. There is another significant energy release at the southern end of the aftershock zone at about 90 seconds, but it is much weaker compared to the major energy release to the north.
 |
 |
| If you are interested in obtaining a high-resolution GIF animation (26 MB), contact Eric Kiser.
| |
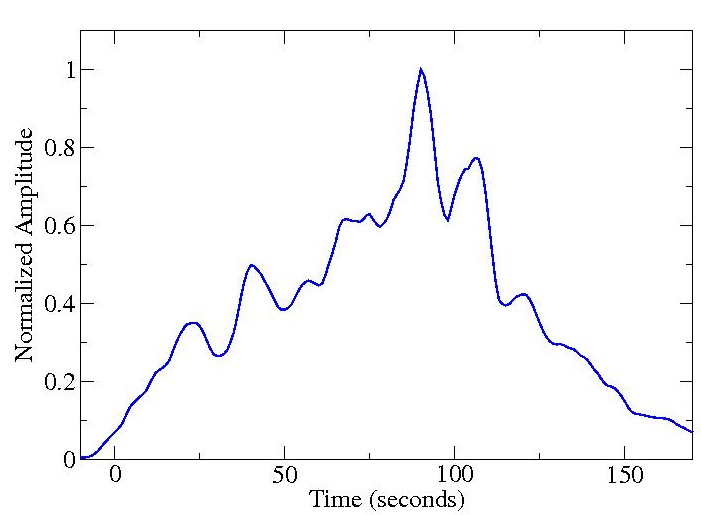 |
Normalized peak amplitude as a function of time, showing six significant high-frequency energy releases at about 20, 40, 70, 90, 110, and 120 seconds. The duration of the event is inferred to be about 150 seconds. The rupture velocity for the energy release north of the epicenter is 3.0 - 3.2 km/s northward. |
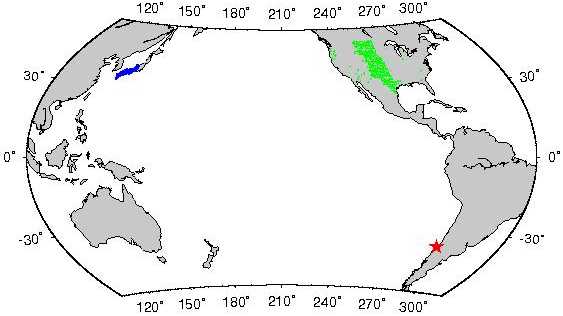 |
Relative Locations of the Earthquake and Array Stations Epicentral location of the Chilean earthquake (red star) with respect to the USArray Transportable Array (390 stations, green triangles) and the subset of Hi-net Array stations (357 stations, blue triangles) used in the back-projection processing. |
References
Kiser, E., & Ishii, M., 2012.
Combining seismic arrays to image the high-frequency characteristics of large earthquakes.
Geophys. J. Int. 188, 1117-1128, doi:10.1111/j.1365-246X.2011.05299.x.
Kiser, E., & Ishii, M., 2011.
The 2010 Mw 8.8 Chile earthquake: Triggering on multiple segments and frequency‐dependent rupture behavior.
Geophys. Res. Lett. 38, L07301, doi:10.1029/2011GL047140.
Kiser, E., & Ishii, M., 2010.
Modeling the 2010 Chile earthquake rupture with USArray.
inSights, the EarthScope Newsletter, fall 2010, 2.
Acknowledgment
The Hi-Net array data used in the analysis were generously made available on the internet by the National Research Institute for Earth Science and Disaster Prevention. The USArray Transportable Array data were obtained from the Incorporated Research Institutions for Seismology Data Management Center.