Preliminary Rupture Modelling of the April 11, 2012 Sumatran Earthquakes
Point of contact: Eric Kiser
The Mw 8.6 and Mw 8.2 earthquakes off the northern coast of Sumatra occurred on the Indian-Australian plate, south of the area where largest slip has been inferred for the 2004 Mw 9.3 Sumatra-Andaman earthquake. We study the pair of events using Hi-net array data.
If you are interested in obtaining higher-resolution QuickTime animations, please contact Eric Kiser.
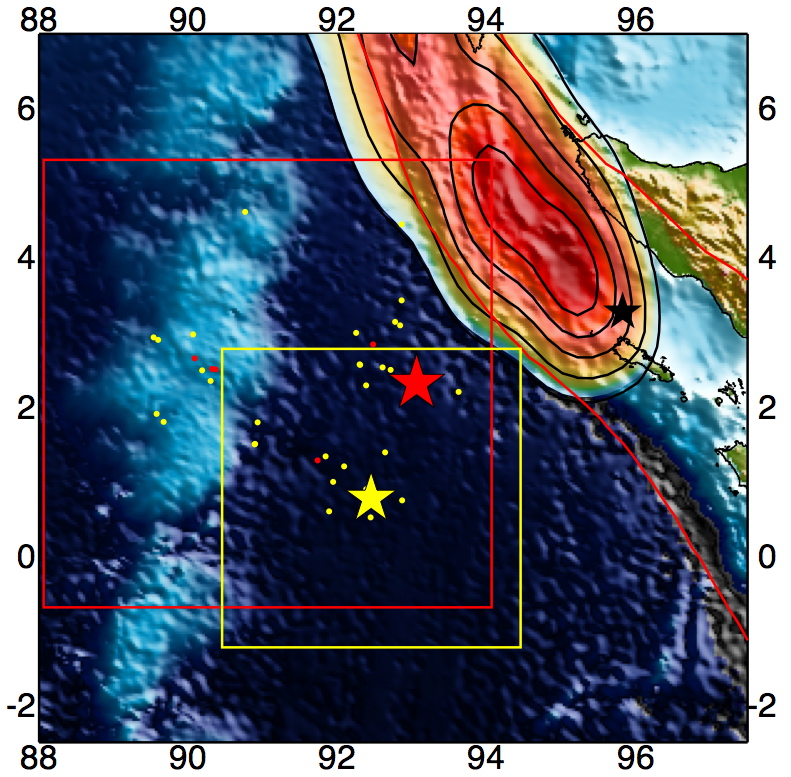 |
Region around the April 11, 2011 earthquakes. The red star shows the epicentral location of the Mw 8.6 earthquake (08:38:37 UTC), and the yellow star shows the epicentral location of the Mw 8.2 earthquake (10:43:09 UTC). The background colours ranging from dark blue to green/brown show the bathymetry/topography. The area to the northeast with reddish colours and black contours shows the rupture region of the 2004 Sumatra-Andaman earthquake with colours indicating the relative amount of energy release and the black star showing the epicentral location.
The plate boundary is shown by red curves. |
Rupture Propagation of 08:38:37 Mw 8.6 Earthquake
 |
 |
The animation above shows locations of rupture/high-frequency energy release for the Mw 8.6 earthquake. The first episode of the event is a bilateral rupture with initial propagation to the east of the epicentre (red star) followed by western/northwestern propagation. This west/northwest propagation can be divided into two subevents that are separated by about 30 seconds and 90 km. The rupture then jumps to the south and begins the second, lower amplitude episode of the event. The propagation is nearly parallel to the trend of the first episode, but it is unilateral to the northwest. The rupture stops when it reaches the ninety-east ridge, resulting in a length and duration of about 250 km and 80 seconds, respectively. The rupture locations imaged by the back-projection technique match very well with the aftershock distribution (white and pink circles).
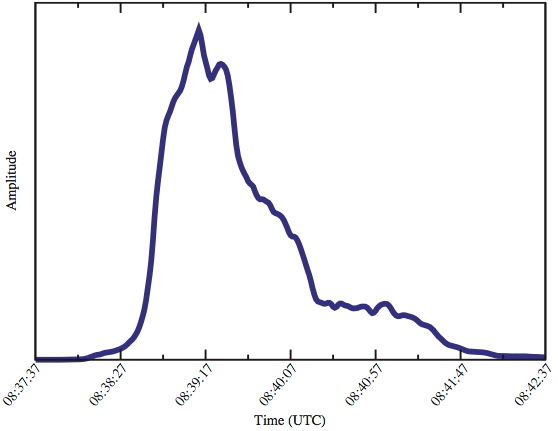
The above right plot shows the relative amplitude of energy release during the Mw 8.6 earthquake. The largest high-frequency energy release occurs at about 35 seconds from the hypocentral time when the rupture is occurring to the west/northwest of the epicentre. The duration of this complex earthquake is about 180 seconds with the first episode of rupture around the epicentre taking 100 seconds followed by the second episode of the southeast to northwest propagation occurring over 80 seconds.
Rupture Propagation of 10:43:09 Mw 8.2 Earthquake
 |
 |
This animation shows locations of rupture/high-frequency energy release for the Mw 8.2 earthquake. This earthquake begins with a northeast rupture that last about 45 seconds. Immediately following the initial rupture is a second subevent that begins south of the epicentre and propagates to the southeast for about 35 seconds.
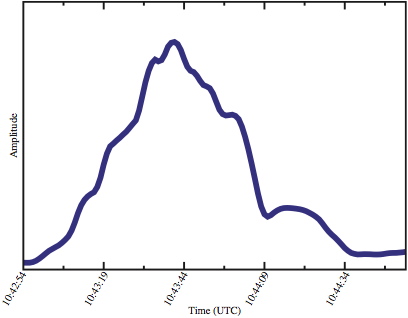
The above right plot shows the relative amplitude of energy release during the Mw 8.2 earthquake. The largest high-frequency energy release occurs at about 30 seconds from the hypocentral time when the rupture is northeast of the epicentre. The duration of this earthquake is about 80 seconds.
High-Sensitivity Seismograph Network of Japan (Hi-net)
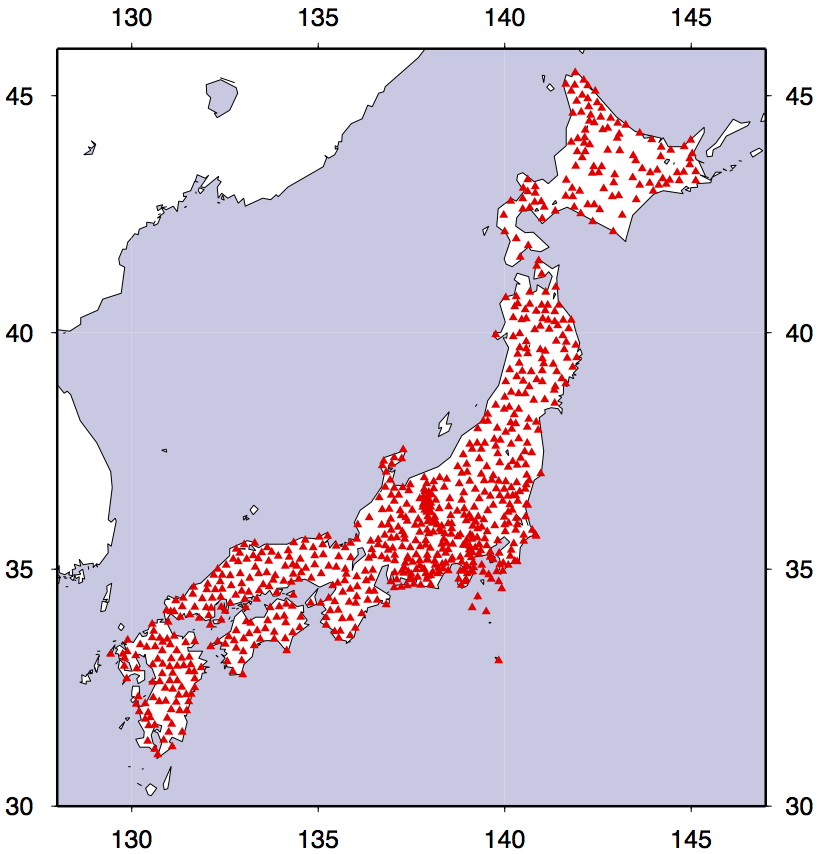 |
The distribution of 770 stations (red circles) that make up the High-Sensitivity Seismograph Network (Hi-net) at the time of the Mw 8.6 earthquake. We use the first-arriving P waveform, and hence utilize only the vertical recordings. This array provides distance coverage between 45 to 62 degrees, and azimuthal coverage between 37 and 50 degrees (both with respect to the Mw 8.6 earthquake). To obtain maximum spatial resolution, the seismograms have been filtered to 0.8-2 Hz. |
Publications
Ishii, M., Kiser, E., \ Geist, E.L., 2013.
Mw 8.6 Sumatran earthquake of April 11, 2012: Rare seaward expression of oblique subduction.
Geology 41, 319-322, doi:101130/G33783.1.
Other Earthquakes
December 26, 2004 Mw 9.3 Sumatra-Andaman Earthquake
February 27, 2010 Mw 8.8 Maule, Chile Earthquake
March 11, 2011 Mw 9.0 Tohoku-Oki, Japan Earhtquake
The Hi-net array data used in the analysis were generously made available on the internet by the National Research Institute for Earth Science and Disaster Prevention.