Rupture Modelling of the March 28, 2005 Sumatran Earthquake using the Hi-net Array
Point of contact: Miaki Ishii
The March 28, 2005 Mw 8.6 Sumatran earthquake occurred about 3 months after the devastating 2004 Sumatra-Andaman earthquake, and is located immediately to the south of the 2004 rupture zone. Similarly to the 2004 event, we use the the Hi-net array in Japan to image the rupture details of the 2005 earthquake. Our results show that unlike the 2004 Sumatra-Andaman earthquake which propagated unilaterally northward along the plate boundary, the 2005 Sumatran earthquake propagates bilaterally. It starts by going northwestward toward the rupture zone of the 2004 event, but reverses direction when it reaches the 2004 rupture zone and moves southeastward.
Rupture Propagation
 |
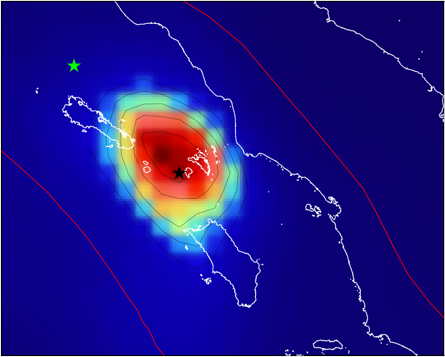
Propagation of rupture as imaged by the Hi-Net array. The plotted quantity is the squared amplitude of the back-projected stacks, i.e., proportional to released energy at high frequencies. The red star is the epicentre of the 2005 Mw 8.6 earthquake, and the green star is the epicentre of the 2004 Mw 9.3 Sumatra-Andaman earthquake. Time with respect to the hypocentral time is shown at the top left corner. |
Rupture Area
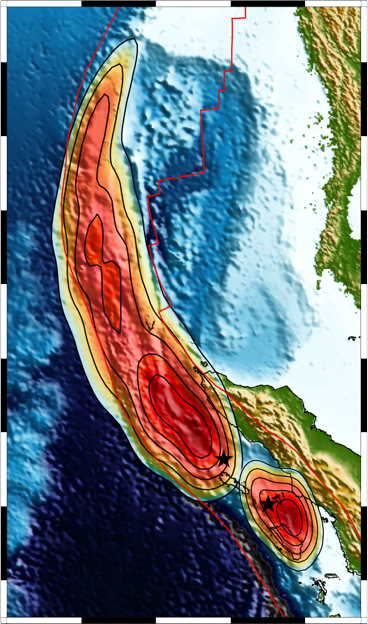 |
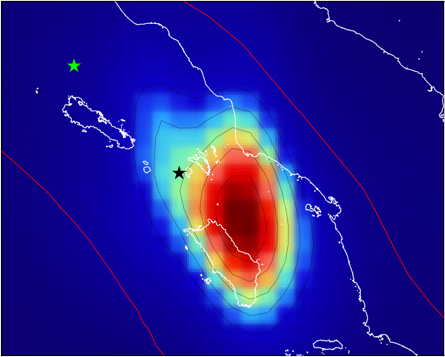
(Left) The red contoured areas shows the rupture areas of the 2004 (north) and 2005 (south) Sumatran earthquakes, with darker red colours indicating higher energy release. The black stars indicate the epicentres of the 2004 and 2005 events, and the surface topography and bathymetry obtained from
ETOPO2 are used as the background. | |
|---|---|---|
 |
 |
|
Reference
Ishii, M., Shearer, P.M., Houston, H., & Vidale, J.E., 2007.
Teleseismic P wave imaging of the 26 December 2004 Sumatra-Andaman and 28 March 2005 Sumatra earthquake ruptures using the Hi-net array.
J. Geophys. Res. 112, B11307, doi:10.1029/2006JB004700.
The Hi-Net array data used in the analysis were generously made available on the internet by the National Research Institute for Earth Science and Disaster Prevention