| March 11, 2011 Tohoku-Chiho Taiheiyo-Oki, Japan Earthquake | |

|
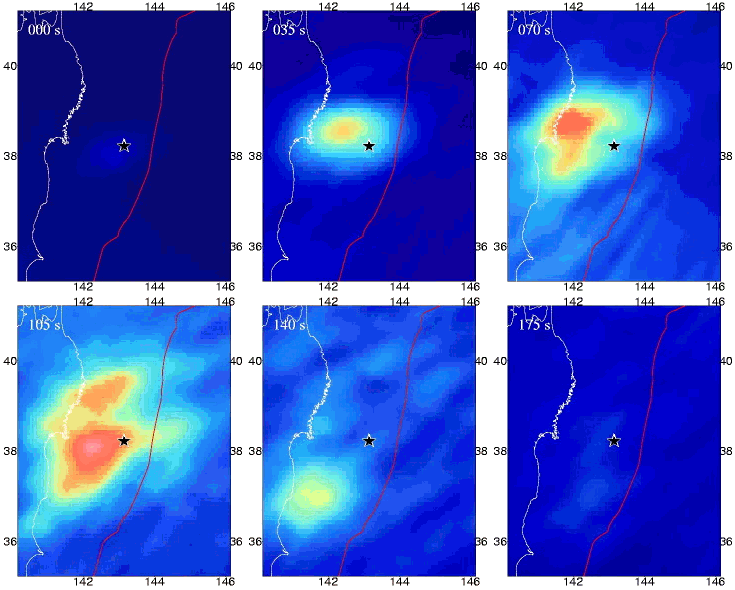
An animation of the rupture process of the Mw 8.9 earthquake as imaged at high frequency using data from the Transportable Array stations of the EarthScope project and the F-net in Japan. Time from the initiation of the earthquake is shown at the top-left corner. For more information on this topic go here. |
| February 27, 2010 Maule, Chile Earthquake | |

|
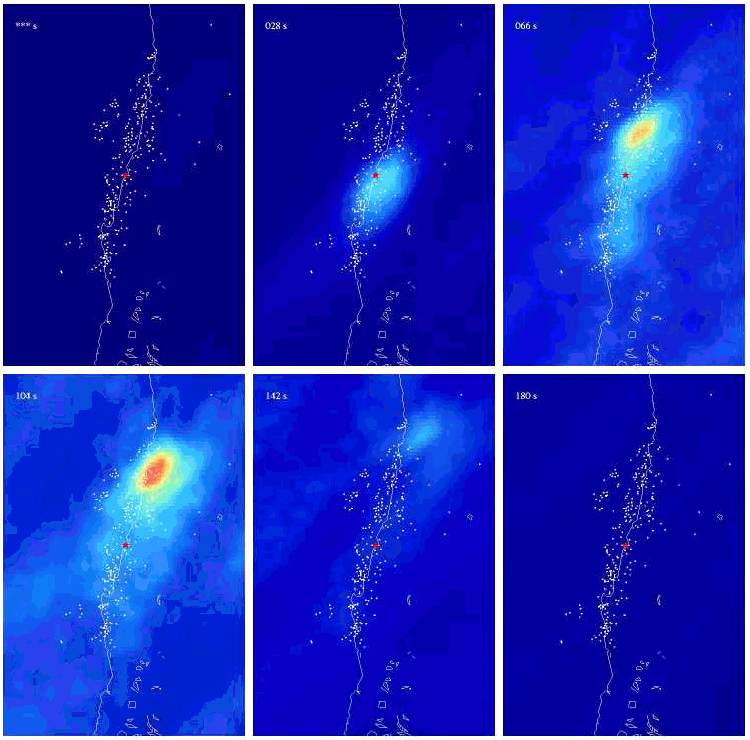
An animation of the rupture process of the Mw 8.8 earthquake as imaged at high frequency using data from the Transportable Array stations of the EarthScope project and the F-net in Japan. Time from the initiation of the earthquake is shown at the top-left corner. For more information on this topic go here. |
| December 26, 2004 Sumatra-Andaman Earthquake | |

|
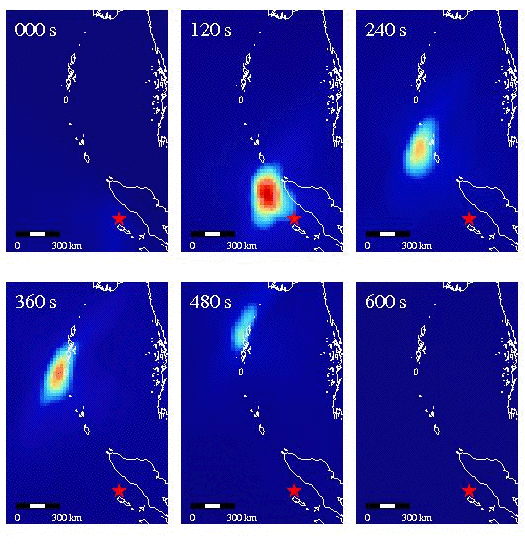
An animation showing the rupture propagation/high-frequency energy radiation during the December 26, 2004 Sumatra-Andaman earthquake which devastated countries around the Indian Ocean. Red star denotes the epicentral location. Time from the beginning of the event is given at the top-left corner. "New Method for Imaging Dec. 26 Indian Ocean Earthquake Yields Unprecedented Results" (Scripps Institution of Oceanography News) For more information on this topic go here. |
Earthquake source physics
Lorem ipsum dolor sit amet, consectetur adipiscing elit. Quisque quis arcu nisl, ac luctus lorem. Ut sed augue eu eros porttitor condimentum sed at risus. Nunc magna orci, pulvinar ut dictum id, consectetur quis diam. Nunc condimentum nisi et purus auctor a interdum ligula fermentum. Ut mattis sapien id metus feugiat congue. Fusce pharetra pulvinar nibh, at mollis enim viverra quis. Mauris ac ligula nec enim tempus dapibus. Pellentesque commodo sem at enim elementum aliquet. Morbi laoreet tempus ante auctor facilisis. Aenean euismod sagittis luctus. Donec aliquet, velit vitae ullamcorper feugiat, odio turpis tincidunt purus, a semper nibh dui eu risus. Nam luctus dui ut eros aliquam rutrum.
Earth structure
The first major global tomographic study of the Earth was made by Professor Adam M. Dziewonski in the early 70's. The idea of this study was that the travel time anomalies observed for many ray paths, criss-crossing the Earth between various points near the Earth's surface and reaching different depths in its interior, could be resolved formally into a three-dimensional (3-D) model. This procedure is now called `seismic tomography', as it conceptually resembles the medical CAT-scan. The early results were reported orally in 1974 and 1975 by Prof. Dziewonski and a full report was published in January 1977 (Dziewonski et al., 1977). A more detailed description can be found on Prof. Dziewonski's page.
The motivation for studying 3-D structure of the Earth's interior is that it may offer the best information on the dynamic processes in the deep interior of the Earth. As the seismic wave speeds change with temperature, it is plausible to obtain 3-D snapshots of the convection pattern in the Earth.
Anisotropy of the Earth's Inner and Innermost Inner Core
An illustration of the Earth's interior, showing heterogeneous mantle (layer with colours varying from red to blue), homogenous outer core (pale blue layer), and anisotropic inner (pink) and innermost (red) inner core. Using seismic waves recorded at antipodal distances (`180 degrees from the source, i.e., on the other side of the globe), the peculiarity of the central 300 km of the inner core (innermost inner core, red region) is inferred.
Also see this Harvard Gazette article.
3-D Mantle Models Using Normal-Mode Data
3-D models of large-scale variations within the mantle can be obtained from normal modes or free oscillations of the Earth. These models show that the regions of high (blue) and low (red) shear-wave speed (top) are anti-correlated with those of bulk-sound speed (middle) near the core-mantle boundary. Furthermore, at this depth (2850 km), lateral variations in density (bottom) is regionally anti-correlated with shear-wave speed variations (e.g., underneath the Pacific and Africa). This observation suggests that considerable amount of compositional heterogeneity exists in the lowermost mantle.
Interesting earthquakes
While most recorded earthquakes are consistent with expectations based on current understandings of plate tectonics, and with simplifying assumptions about the earthquake source, there are a number of very interesting exceptions. Earthquakes with non-double couple focal mechanisms, or which contain a non-zero isotropic component, may be the result of source processes other than slip on a planar fault surface. Earthquakes which occur outside of well-defined bands of seismicity, or which display focal mechanisms at odds with the stress regimes we believe to exist in a given region, may cause us to revise our understanding of regional tectonics, or of deformation processes in general.
The Unusual Earthquakes research effort studies a small number of events in detail, by a variety of methods, in an effort to gain a more thorough understanding of source processes and tectonics which differ from accepted standard models.
Seismic measurements
Lorem ipsum dolor sit amet, consectetur adipiscing elit. Quisque quis arcu nisl, ac luctus lorem. Ut sed augue eu eros porttitor condimentum sed at risus. Nunc magna orci, pulvinar ut dictum id, consectetur quis diam. Nunc condimentum nisi et purus auctor a interdum ligula fermentum. Ut mattis sapien id metus feugiat congue. Fusce pharetra pulvinar nibh, at mollis enim viverra quis. Mauris ac ligula nec enim tempus dapibus. Pellentesque commodo sem at enim elementum aliquet. Morbi laoreet tempus ante auctor facilisis. Aenean euismod sagittis luctus. Donec aliquet, velit vitae ullamcorper feugiat, odio turpis tincidunt purus, a semper nibh dui eu risus. Nam luctus dui ut eros aliquam rutrum.