HRV Seismogram Archival Project
StatusScanned Seismograms
Digitized Traces
DigitSeis: Digitization Software
| "... old seismograms, if properly interpreted, provide invaluable information on earthquakes in the past, and every effort should be made to save them, regardless of their quality, from possible loss and to make copies in an easily readable form." | ||
| Kanamori (1988) | ||
Analogue seismometers have been in operation at the Harvard-Adam Dziewonski observatory from 1933 to 1953, and intermittently in operation thereafter up to 1997. These instruments have recorded ground motion resulting from significant earthquakes that have been identified (e.g., NOAA Significant Earthquake Database), earthquakes (large and small) that are not in regular catalogues (e.g., Collins, 1937), nuclear explosions (e.g., Leet, 1946), local explosions both quarry blasting (e.g., Leet, 1954) and experimental explosions (e.g., a note from Louis Slichter giving the exact location of an explosion is found with one of the seismograms), and storms (some seismograms are accompanied by contemporary weather maps of the US; e.g., Leet, 1947).
The collection from the Harvard seismic station consists of approximately 16,000 analogue seismograms. It seems that only seismograms containing earthquake or significant storm activities have been kept. They have been stored in a wooden cabinet under much less than ideal conditions, and are damaged mainly due to moisture and rodent activity. We estimate that about 15% of the collection is damaged beyond recovery. Working with the Weissman Preservation Center at Harvard University, we aim to recover as much of the collection as possible. We plan to clean, scan, digitize, and store seismograms to stop further deterioration, to make digital archive of the recordings, make them available to the community, and to store the original analogue seismograms for potential future use.
The initial phase of this project benefitted from the IRIS summer internship program where the intern, Megan Torpey, began by cataloguing the available seismograms.
Our focus will be on the photographic recordings made between 1933 and 1953. The progress of the project can be checked at the Status page, and scanned images will be made available (availability of images can be checked at the Scanned Seismograms page).
Instruments
Both short-period and long-period instruments were installed at the Harvard seismic station. At the beginning of the operation, the station was equipped with 6 instruments:
- Benioff Vertical Seismogram - Galvanometer 1
Tg=0.2, 0.3 To=1
- Benioff Vertical Seismogram - Galvanometer 2
Tg=13, 13.5, 14 To=1
- Wood-Anderson Horizontal Torsion Seismograph No. 1
EW
- Wood-Anderson Horizontal Torsion Seismograph No. 2
NS
- Milne-Shaw Horizontal Pendulum Seismograph No. 43
NW-SE To=12sec v=25degrees
- Milne-Shaw Horizontal Pendulum Seimosgraph No. 44
NE-SW To=12sec v=25degrees
Information on Seismograms
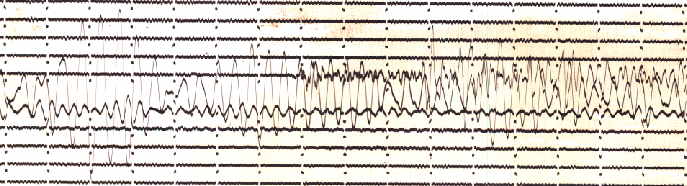
The size of the photographic recordings are 14" by 36", and each seismogram contains about a day of ground motion with some exceptions of long-period recordings made over two days (typically with the NS component). The vertical (Z) and east-west (EW) components of long-period motion are often saved on a single piece of paper with the Z component at the top and the EW component at the bottom. Each horizontal trace corresponds to one hour (60 minutes) of recording for long-period instruments and half an hour (30 minutes) of recording for short-period instruments. At every minute, the seismograms are offset (minute marks), and these marks end at 60 seconds.
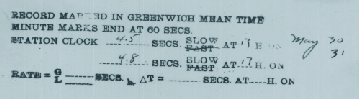
The times indicated on the seismograms are in Greenwich Mean Time. For some of the traces, there appears to be an effort to calibrate time, and this information can be found on the back side of the seismogram. An example is shown below.
Most of the seismograms are stamped at the back with the station information. It reads:
|
HARVARD SEISMOGRAPH STATION OAK RIDGE OBSERVATORY φ = 42°30'26" NORTH λ = 71°33'45" WEST h = 180 METERS |
The back side of each seismogram provides additional information such as the dates and the start and end time of the recordings, type of instrument, component, etc. For this reason, we have chosen to scan this side of the seismograms to go with the front side.
Cleaning and Scanning
|
The seismograms on photographic paper are cleaned on both the front side (with seismic recordings, photographic side) and the back side (with information, regular paper). Loose soil or dirt is first removed with a brush on both sides. The photographic side of the seismograms are then cleaned using non-abrasive wipes to avoid damage to the gloss of the photographic paper. The back side without the photographic surface is less sensitive to abrasion, and is cleaned using very porous sponge. |
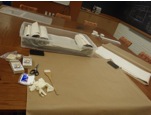 |
Most of the seismograms are strongly curled at the sides and cannot scanned immediately after cleaning. The seismograms are, therefore, flattened by placing them under some weight. Once they are sufficiently flat (the time for flattening depends strongly on the degree of curling, and could take couple of months), they are scanned by large-scale scanner. For more information about scanning and image availability, see Scanned Seismograms page.
DigitSeis: Digitization Software
 |
The raster images of seismograms need to be converted to discretized time series for use in research. This can be achieved by the freely-available software, DigitSeis, that takes advantage of image processing techniques and painstakingly considers time-mark corrections and image distortion to provide as accurate timing and amplitude as possible. This program is written in MATLAB, but the latest version can be installed without having MATLAB. Resulting data are saved both in MATLAB's .mat file and also as SAC files. As we generate these discrete time series, they will be made available along with the raster images. More about this software can be learned at the DigitSeis page. |
Citation
If you use any of the images of seismograms from the HRV station, please refer to the following publication.- Ishii, M., Ishii, H., Bernier, B., & Bulat, E., 2015.
Efforts to recover and digitize analog seismograms from Harvard-Adam Dziewonski observatory.
Seismological Research Letters 86(1), 255-261.
Acknowledgements
The digitization effort has been partially supported by the United States Geological Survey Earthquake Hazard Program through grants G14AP00016, G16AP00021, G17AP0007, and G18AP00018, and by the Miller Institute for Basic Research in Science at the University of California, Berkeley.References
- Collins, M.P., 1937.
The New Hampshire earthquakes of November 9, 1936, and further data on New England travel times.
Bulletin of the Seismological Society of America 27(2), 99-107.- Kanamori, H., 1988.
Importance of historical seismograms for geophysical research.
- Leet, D.L., 1946.
Earth motion from the atomic bomb test.
American Scientist 34(2), 198-211.- Leet, D.L., 1947.
Microseisms in New England - Case history of a storm.
Geophysics 12(4), 639-650.- Leet, D.L., 1954.
Quarry blasting: With short-period delay detonators.
The Explosives Engineer September-October, 142-154. - Kanamori, H., 1988.
Go to Project Status Page
Go to Scanned Seismogram Page
|
Department of Earth and Planetary Sciences / Harvard University / 20 Oxford Street / Cambridge / MA 02138 / U.S.A. /
Telephone: +1 617 495 2350 / Fax: +1 617 496 1907 / Email: reilly@eps.hartvard.edu
|