Examining the Fidelity of Seismic Data Recovered from Mircoformats
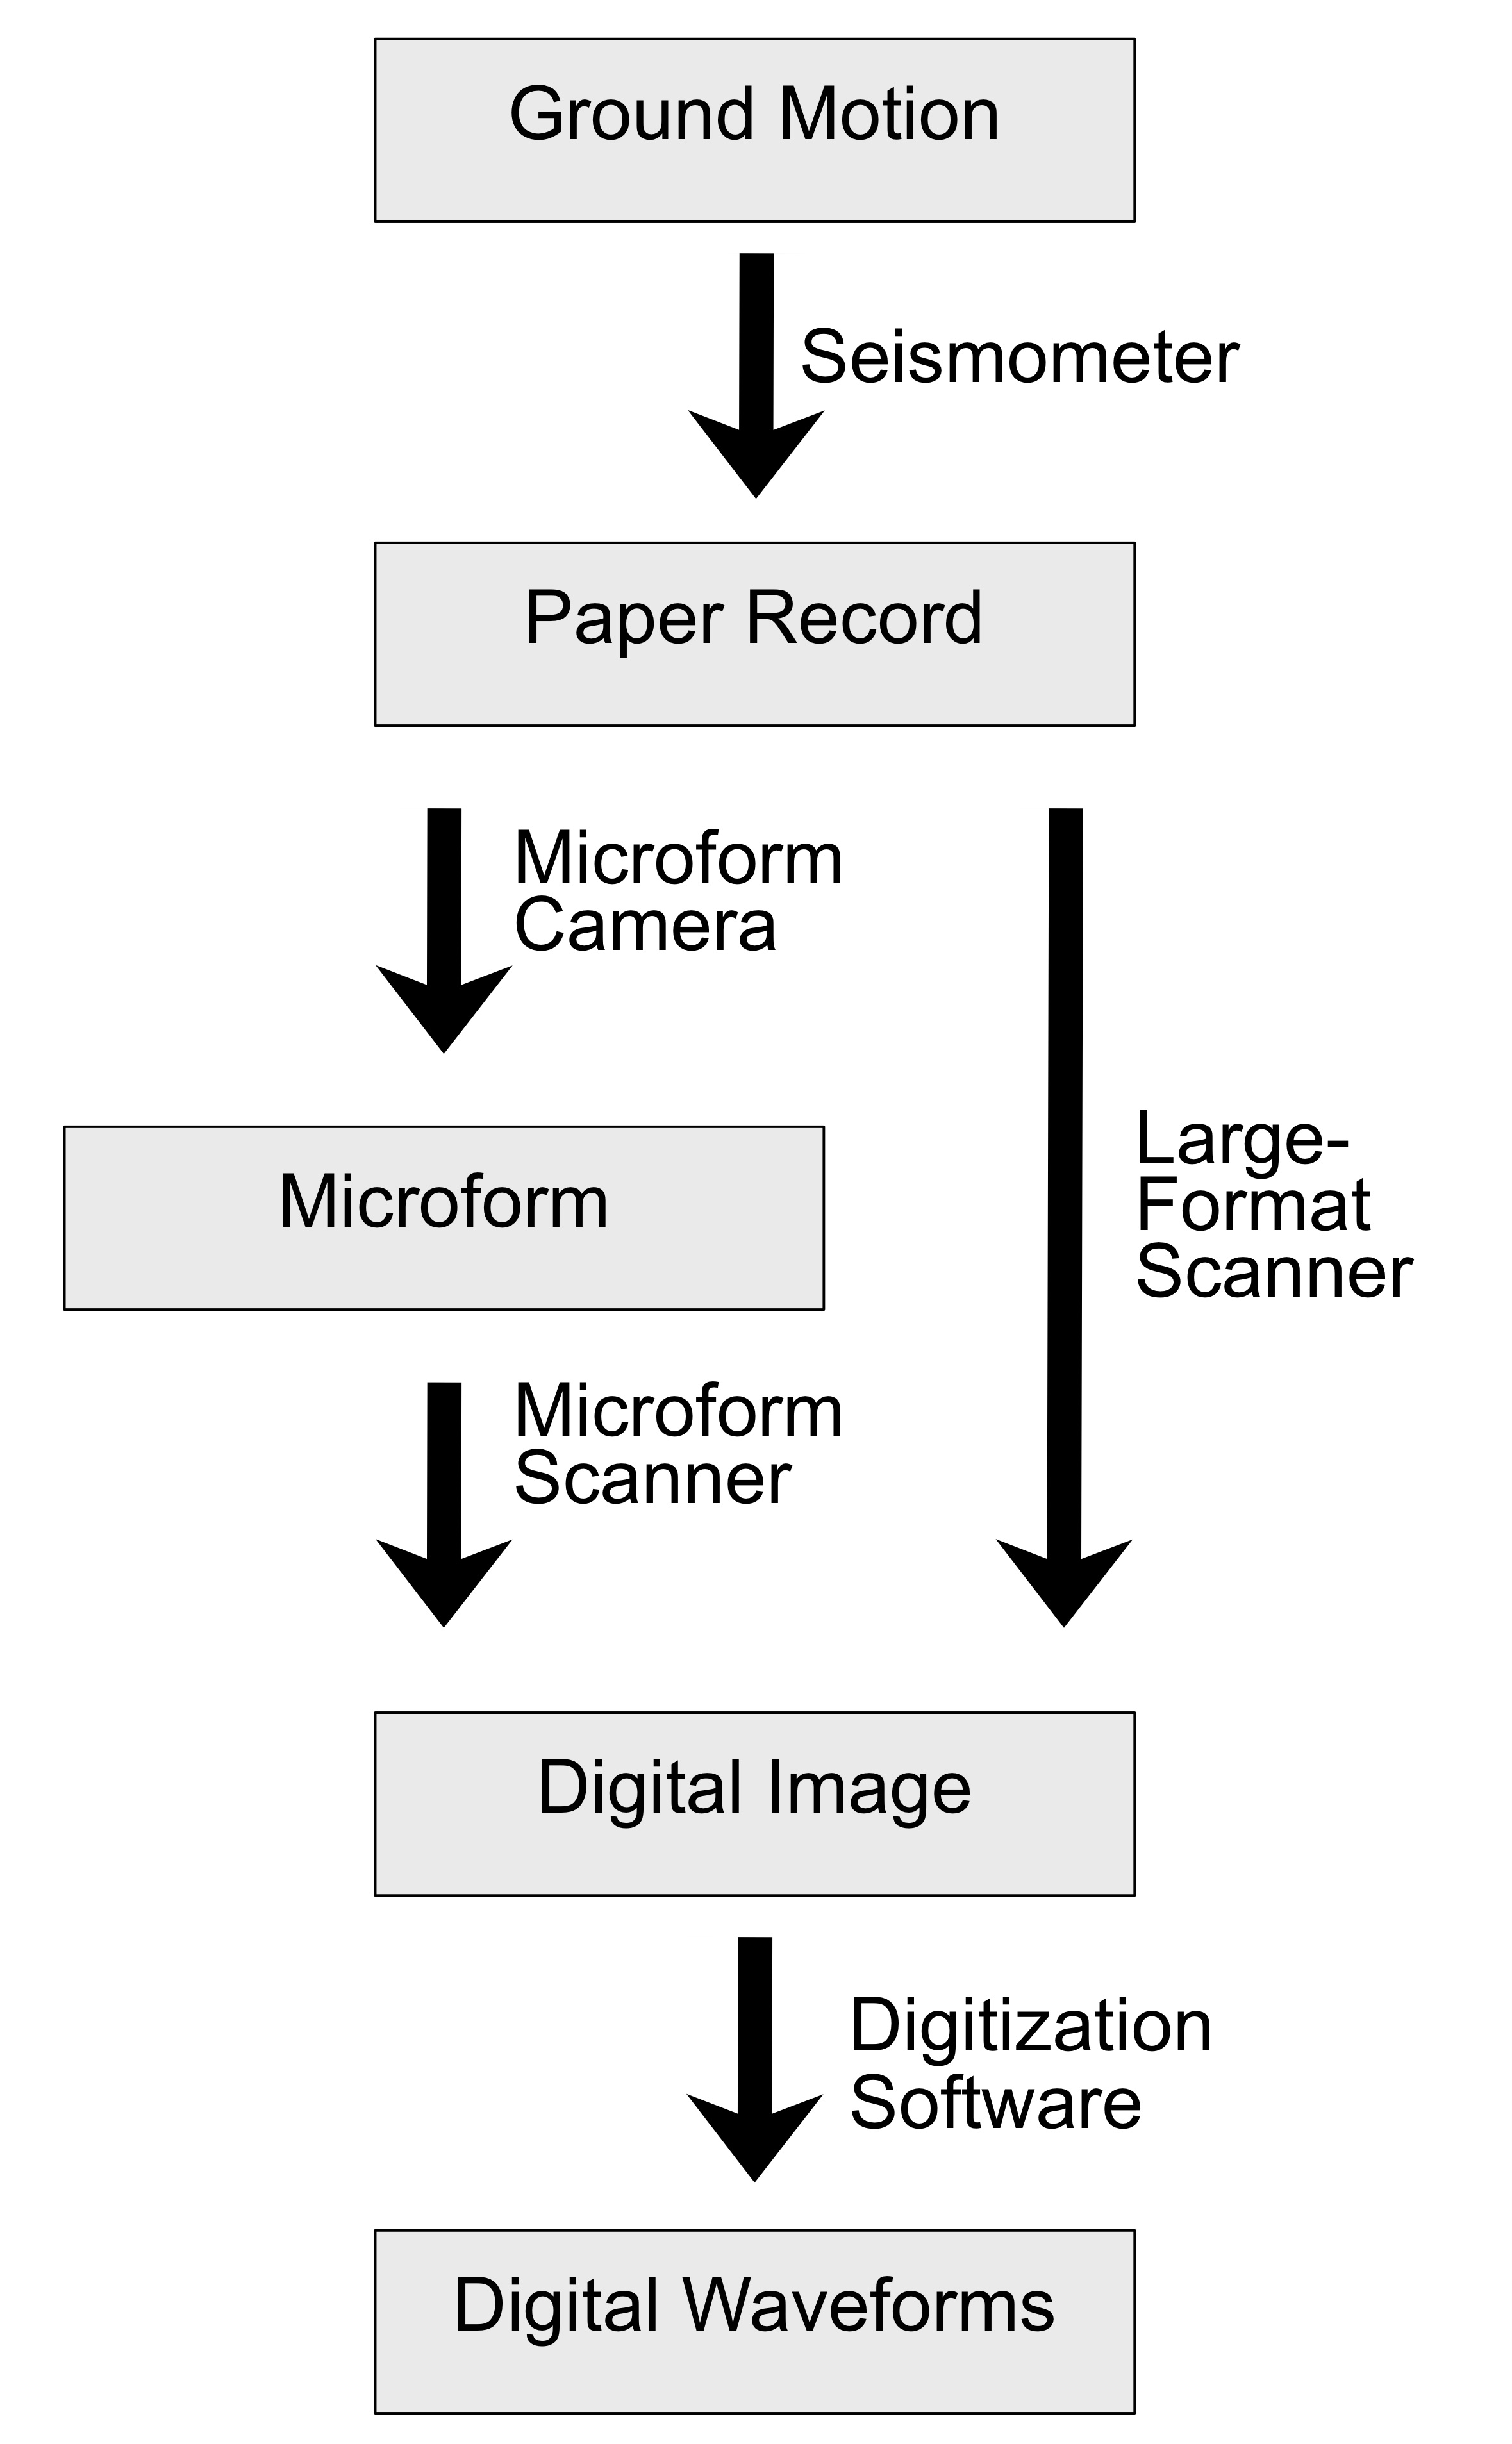
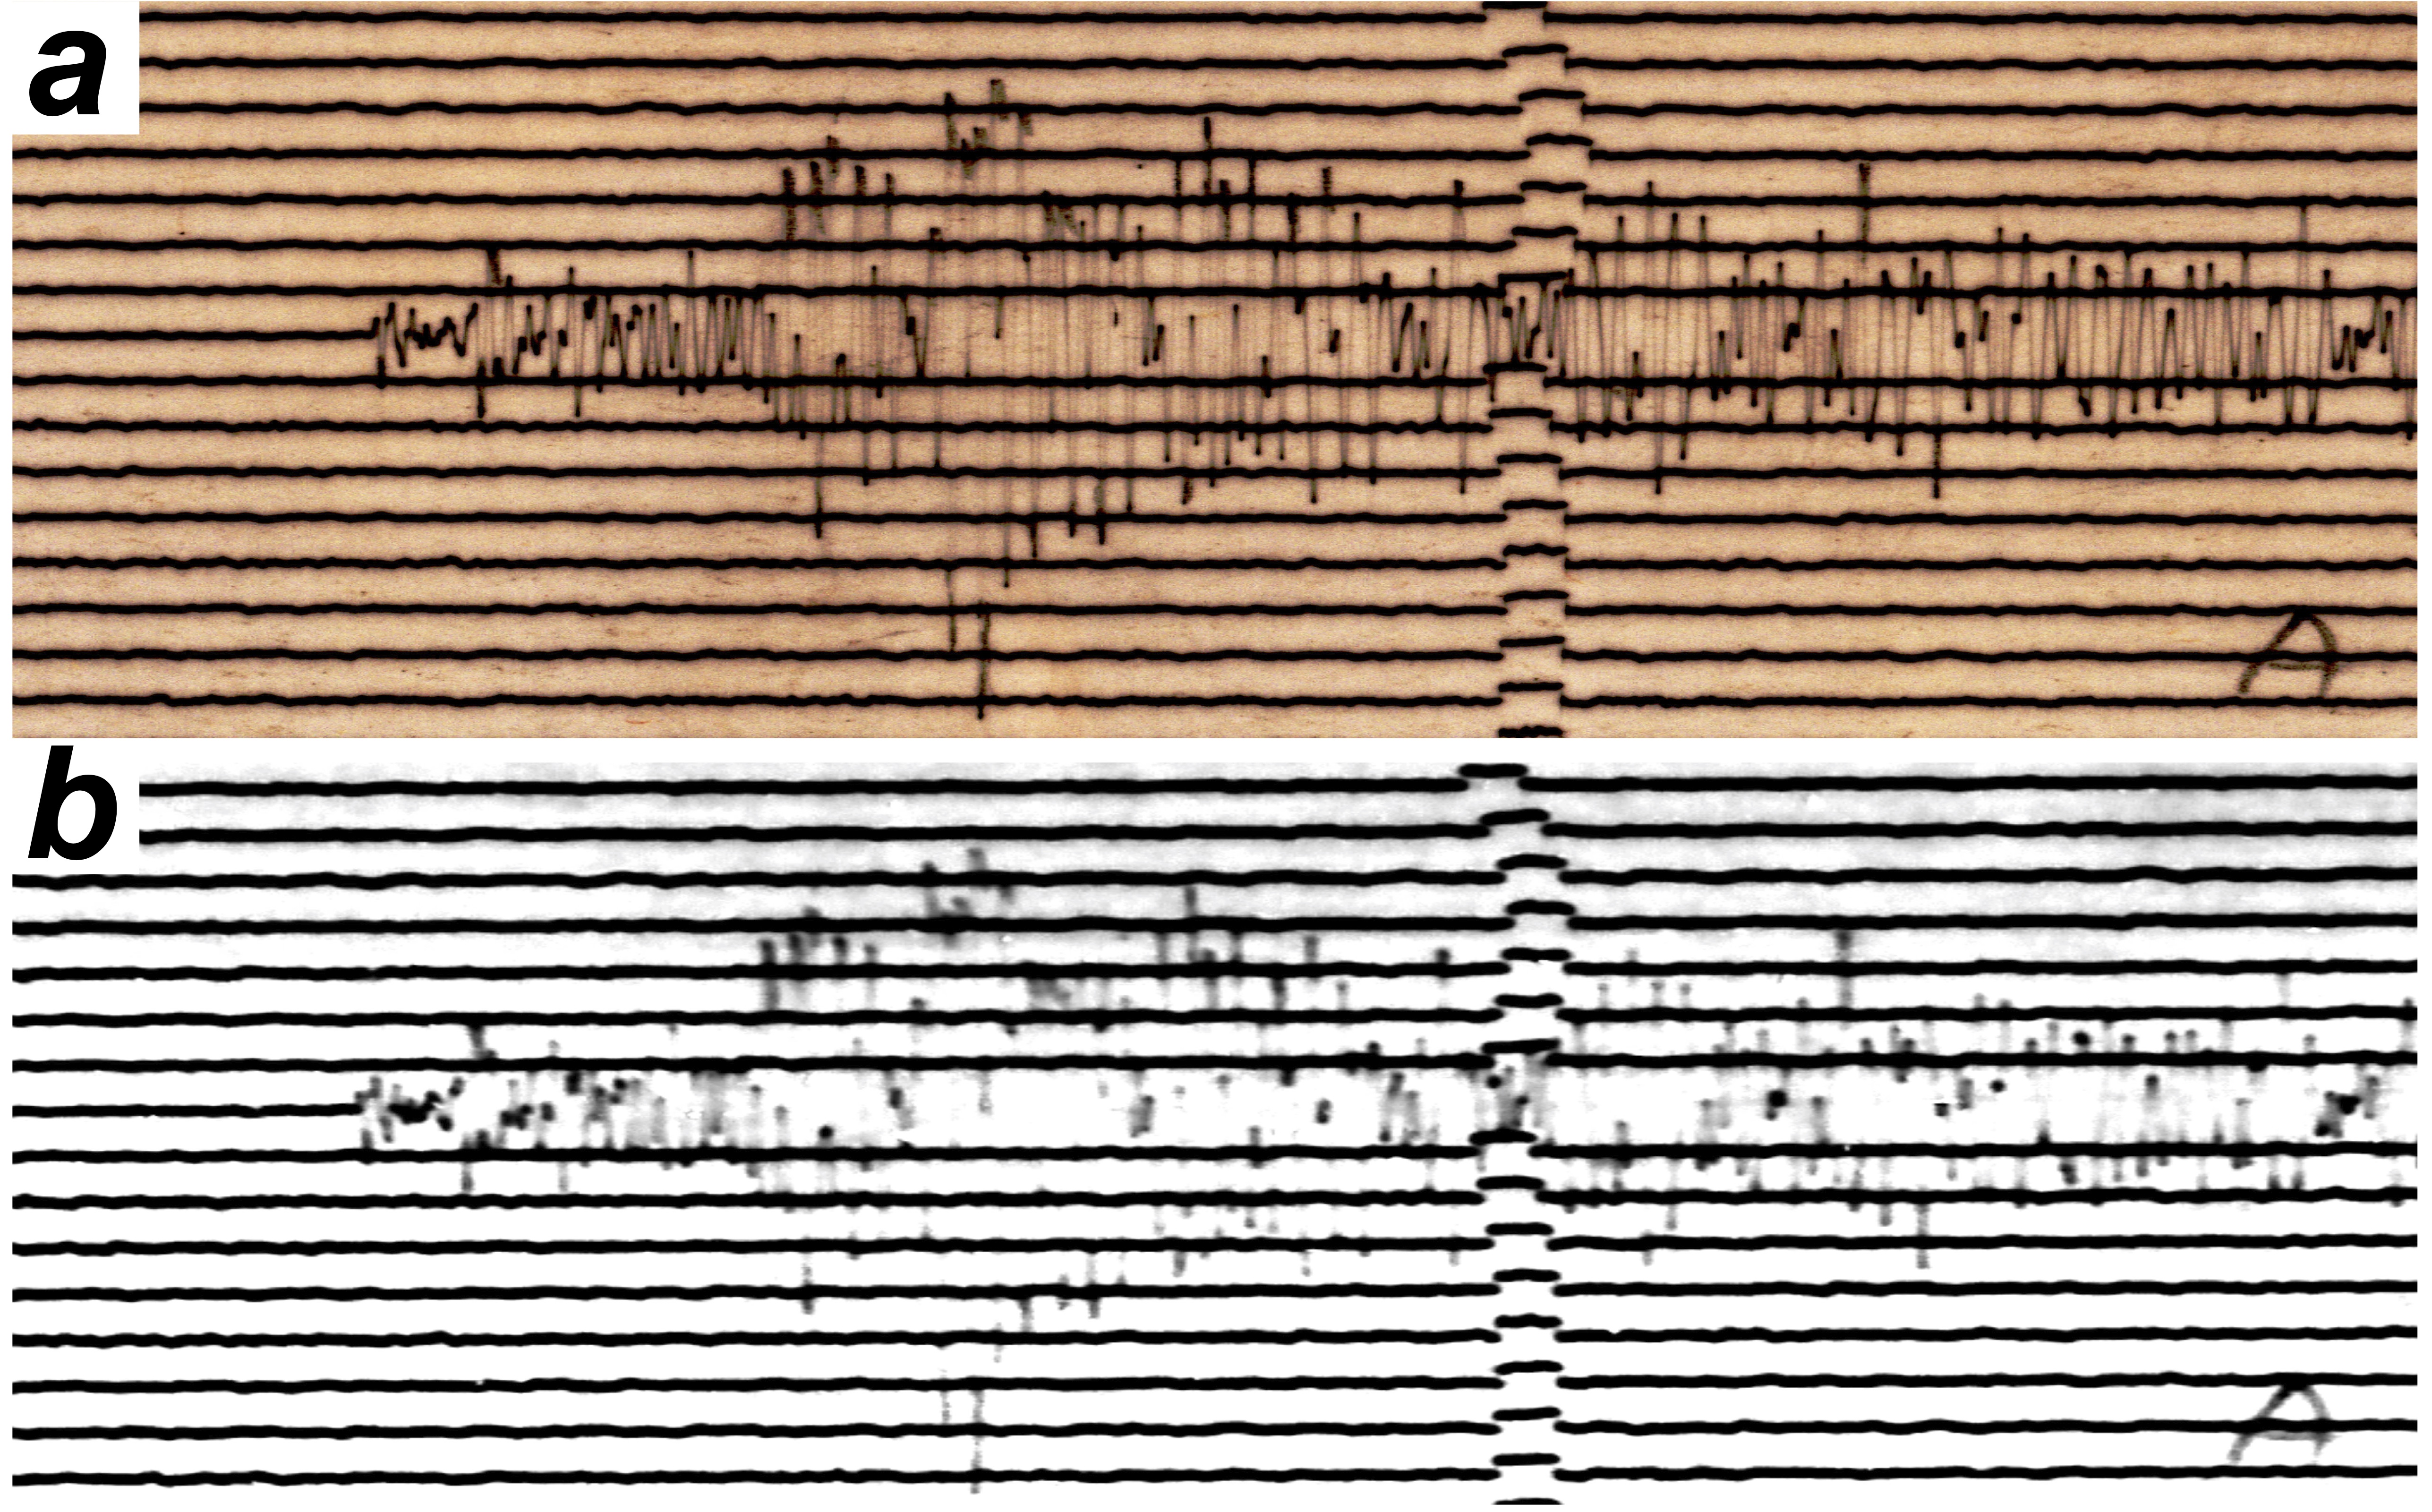
During 1960s and 1970s, substantial numbers of analog seismograms recorded on paper were converted into microfilm or microfiche film chips (Figure 1). Unlike paper records, these microforms are small, and require special equipment to visualize their contents. This project investigates the differences that arise when extracting high quality digital data stored on microfiche or microfilm as compared to the same process applied to their paper counterparts. The goal is to determine the best practices and strategies for the scanning of microforms as well as understanding limitations for time series data derived from them. Upon comparison of two scanned images of the same record -- one from microfilm and one from paper -- it seems likely that there are significant differences between the fidelity of the data recoverable from these two media types (Figure 2).
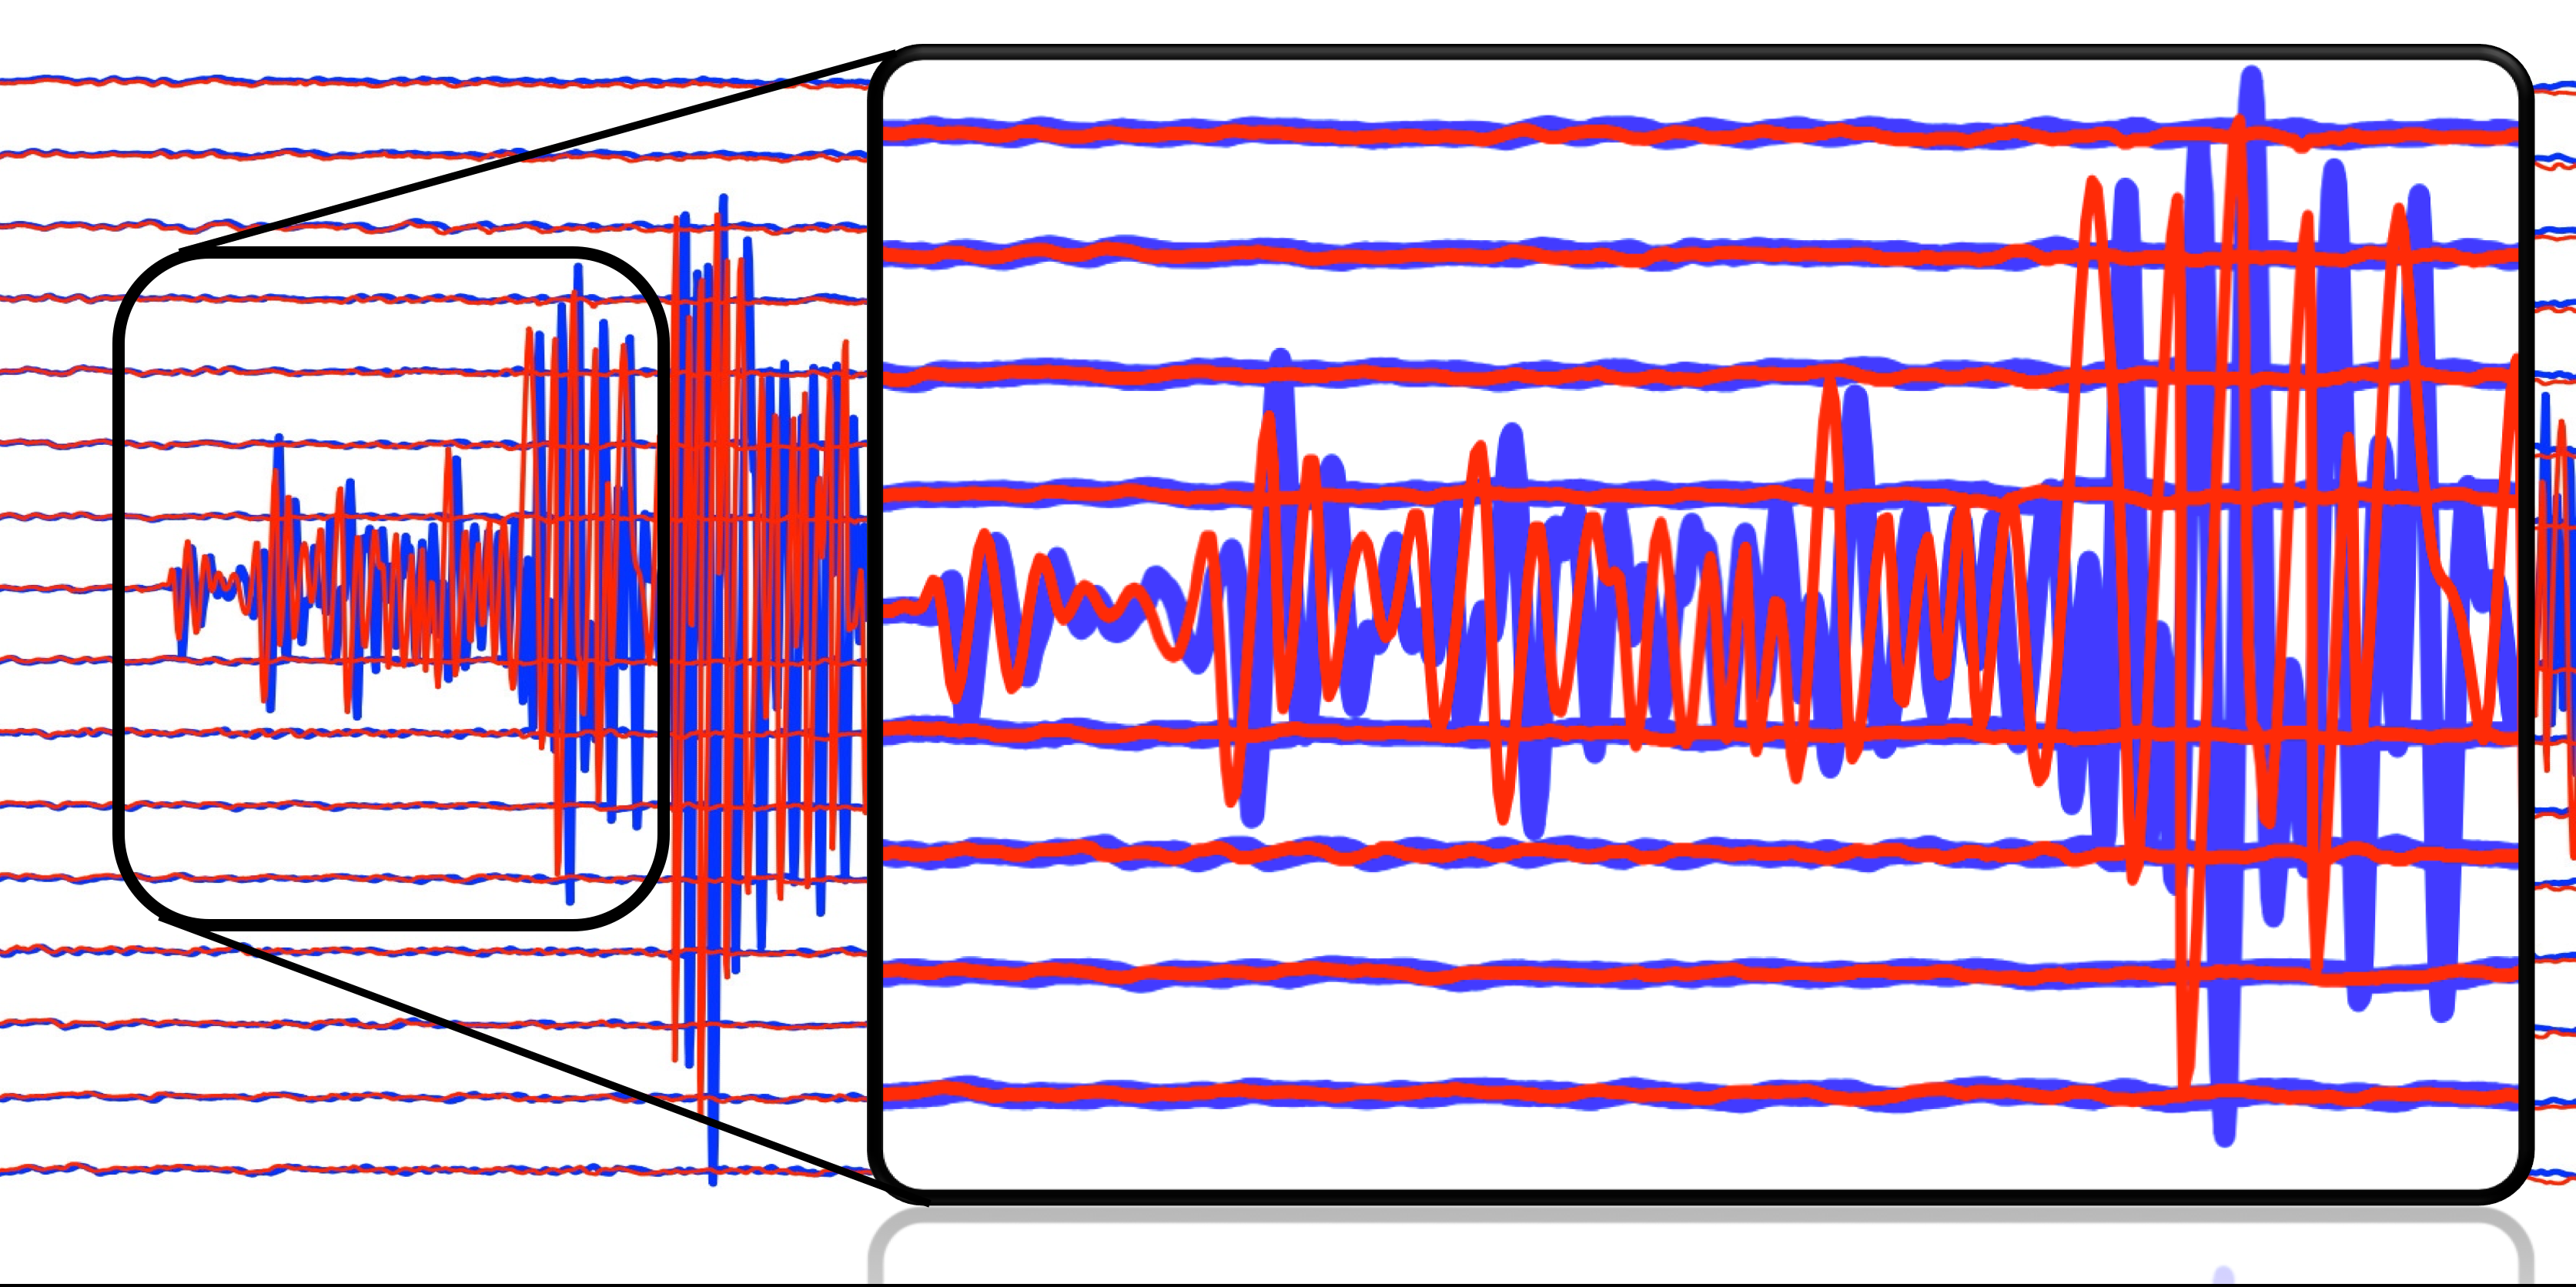
Upon closer examination of the digitized versions of traces seen in Figure 2, we can see that not only do the waveforms have different shapes, but there also seem to be time differences offsetting the traces which are at least 0th order (have time dependence themselves) (Figure 3). The waveform shape differences are largely a result of resolution differences between the two media types, as the microfilm resolution is generally limited by the older viewing and scanning technologies. The timing differences are due to a horizontal distortion in the scanned image that may be non-linear (Figure 4).
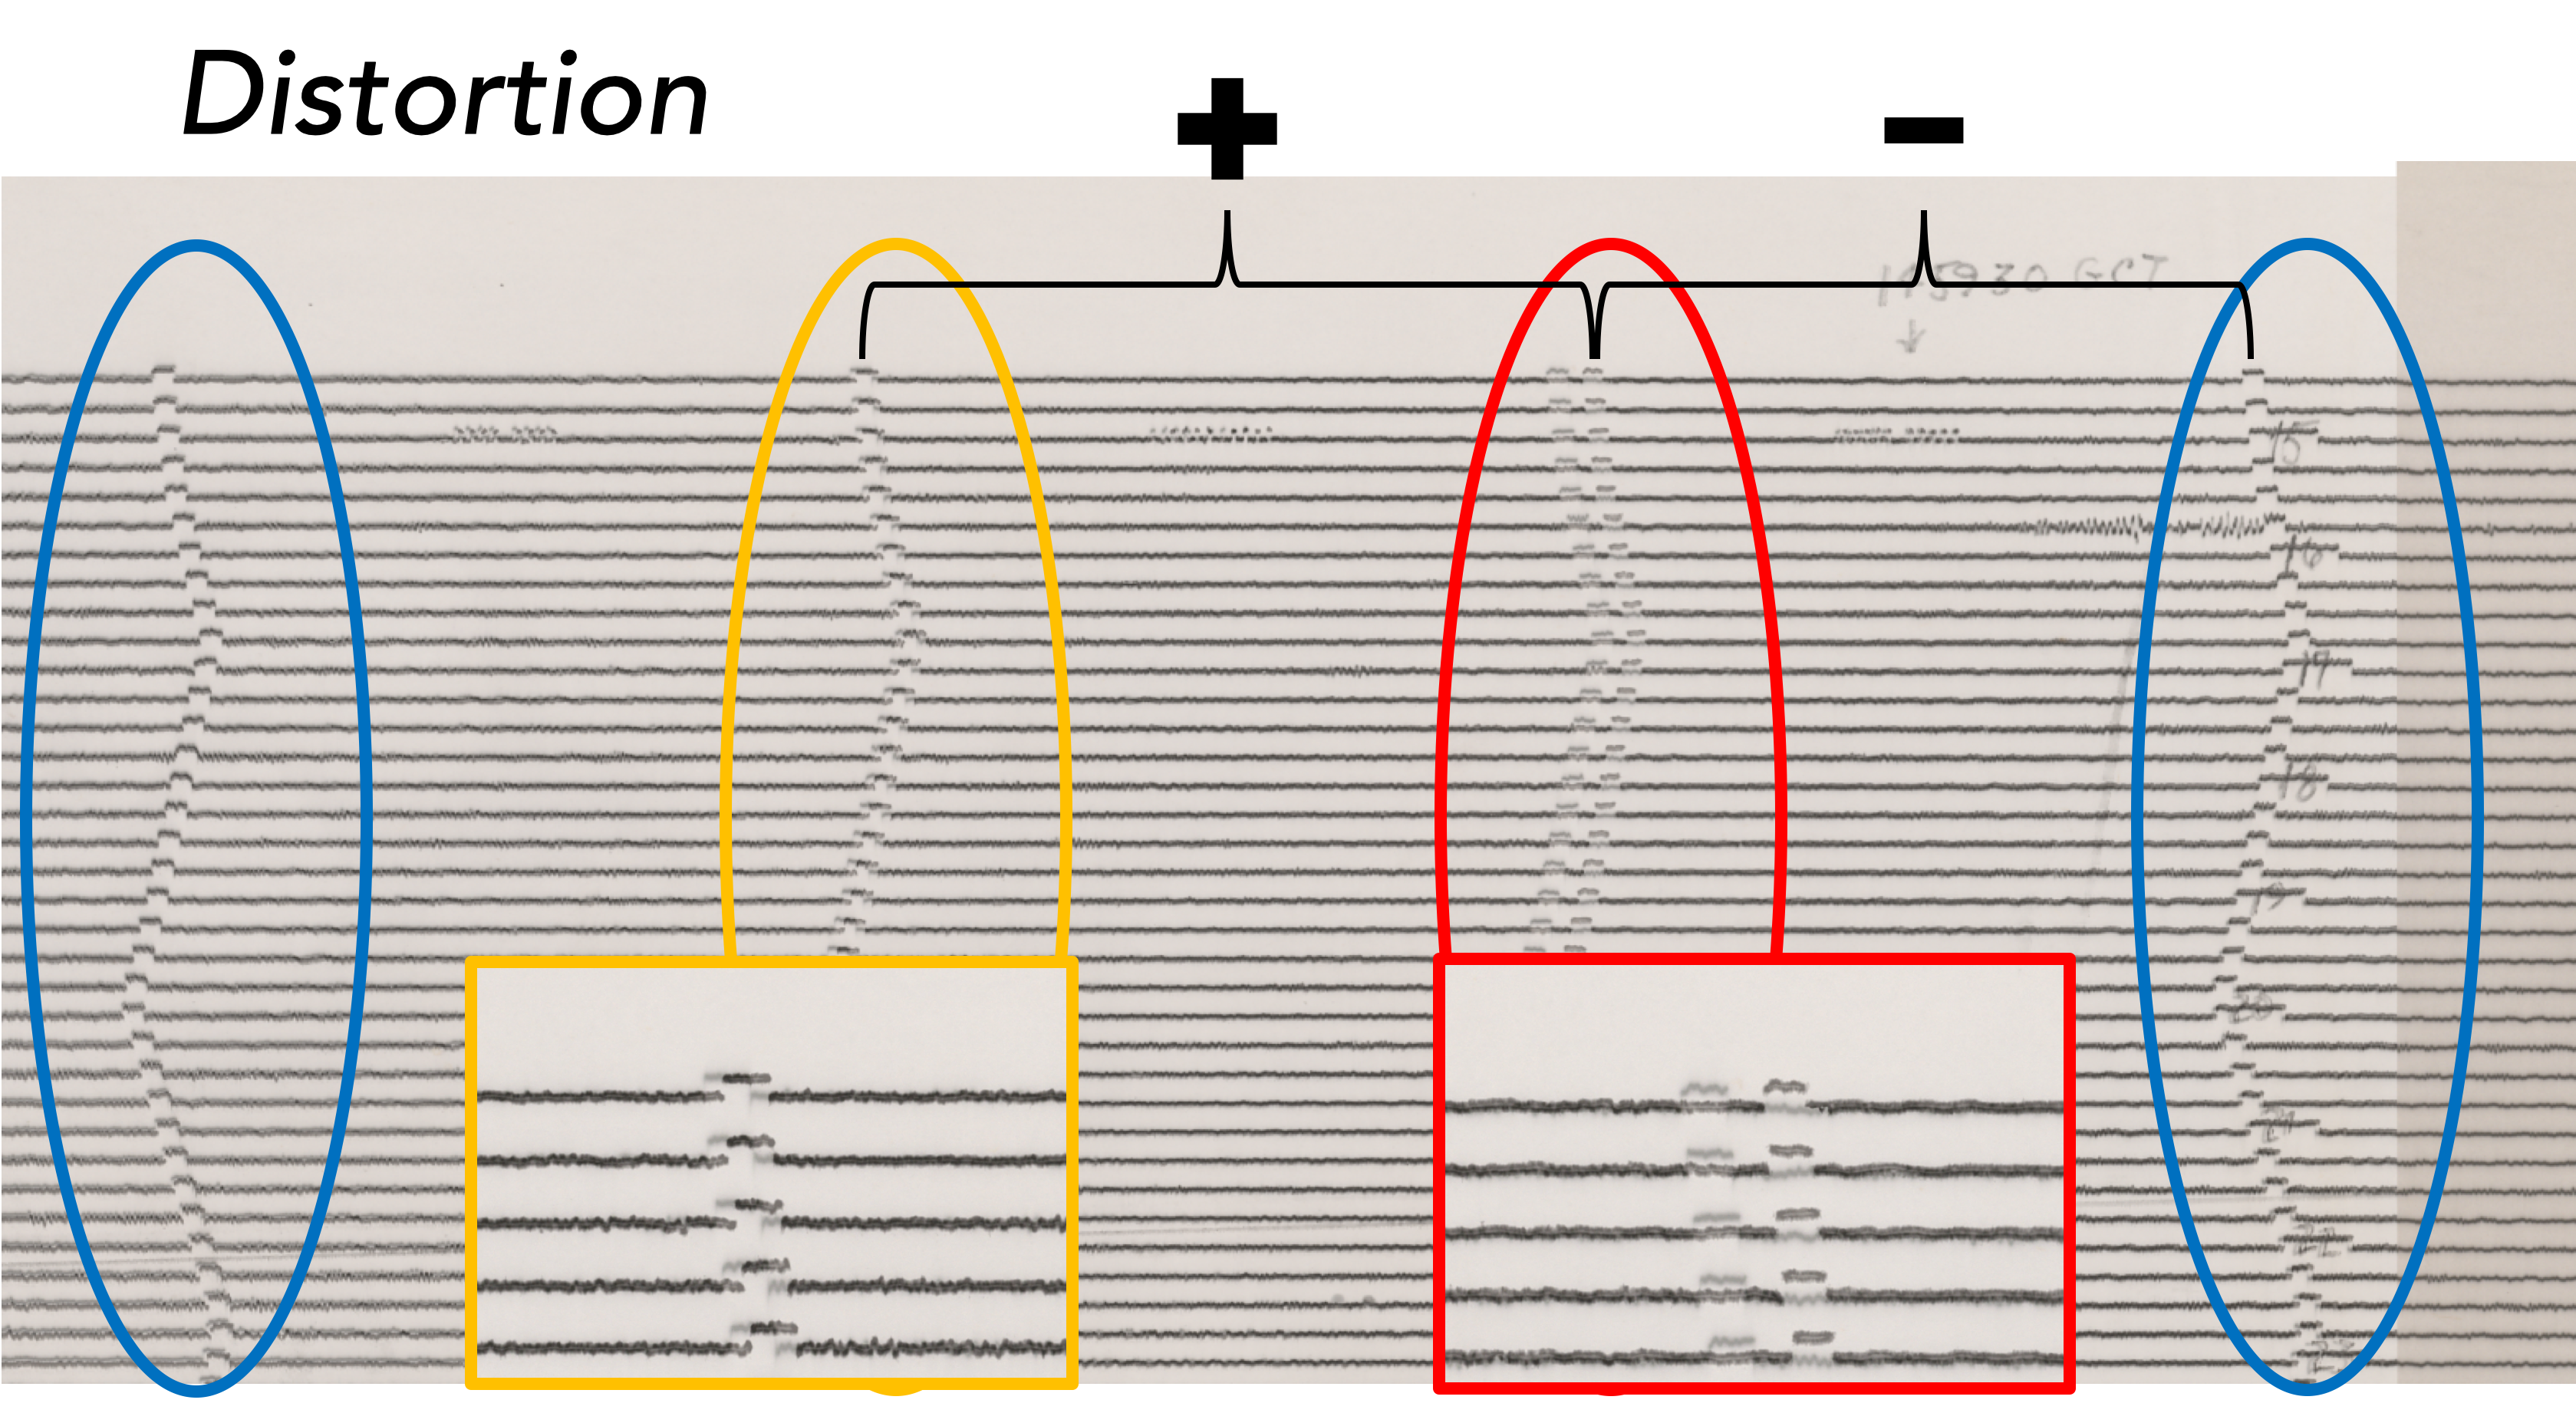
These issues may be due to how the microform records were originally generated (e.g., uneven film feed-speed into the camera causing the horizontal distortion), in which case, any existing original paper records need to be preserved. Alternatively, the issues may be resultant of how the records are scanned (e.g., uneven film feed-speed into the scanner causing horizontal distortion), in which case, better scanning equipment may resolve some issues.