Inversion for Rupture Properties Based Upon Three-Dimensional Directivity Effect
Rupture properties, such as rupture direction, length, propagation speed, and source duration, provide important insights into earthquake mechanisms. One approach to estimate these properties is to investigate the body-wave duration that depends upon the relative location of the station with respect to the rupture direction. Under the assumption that the propagation is unilateral, the duration can be expressed as a function of the dip and azimuth of the rupture (Figure 1a). Examination of duration measurements with respect to both the take-off angle and the azimuth is crucial to obtain robust estimates of rupture parameters, especially for nearly vertical rupture propagation. Moreover, limited data coverage, such as using only teleseismic data, can bias the source duration estimate for dipping ruptures (Figure 1b), and this bias can map into estimates of other source properties such as rupture extent and rupture speed.
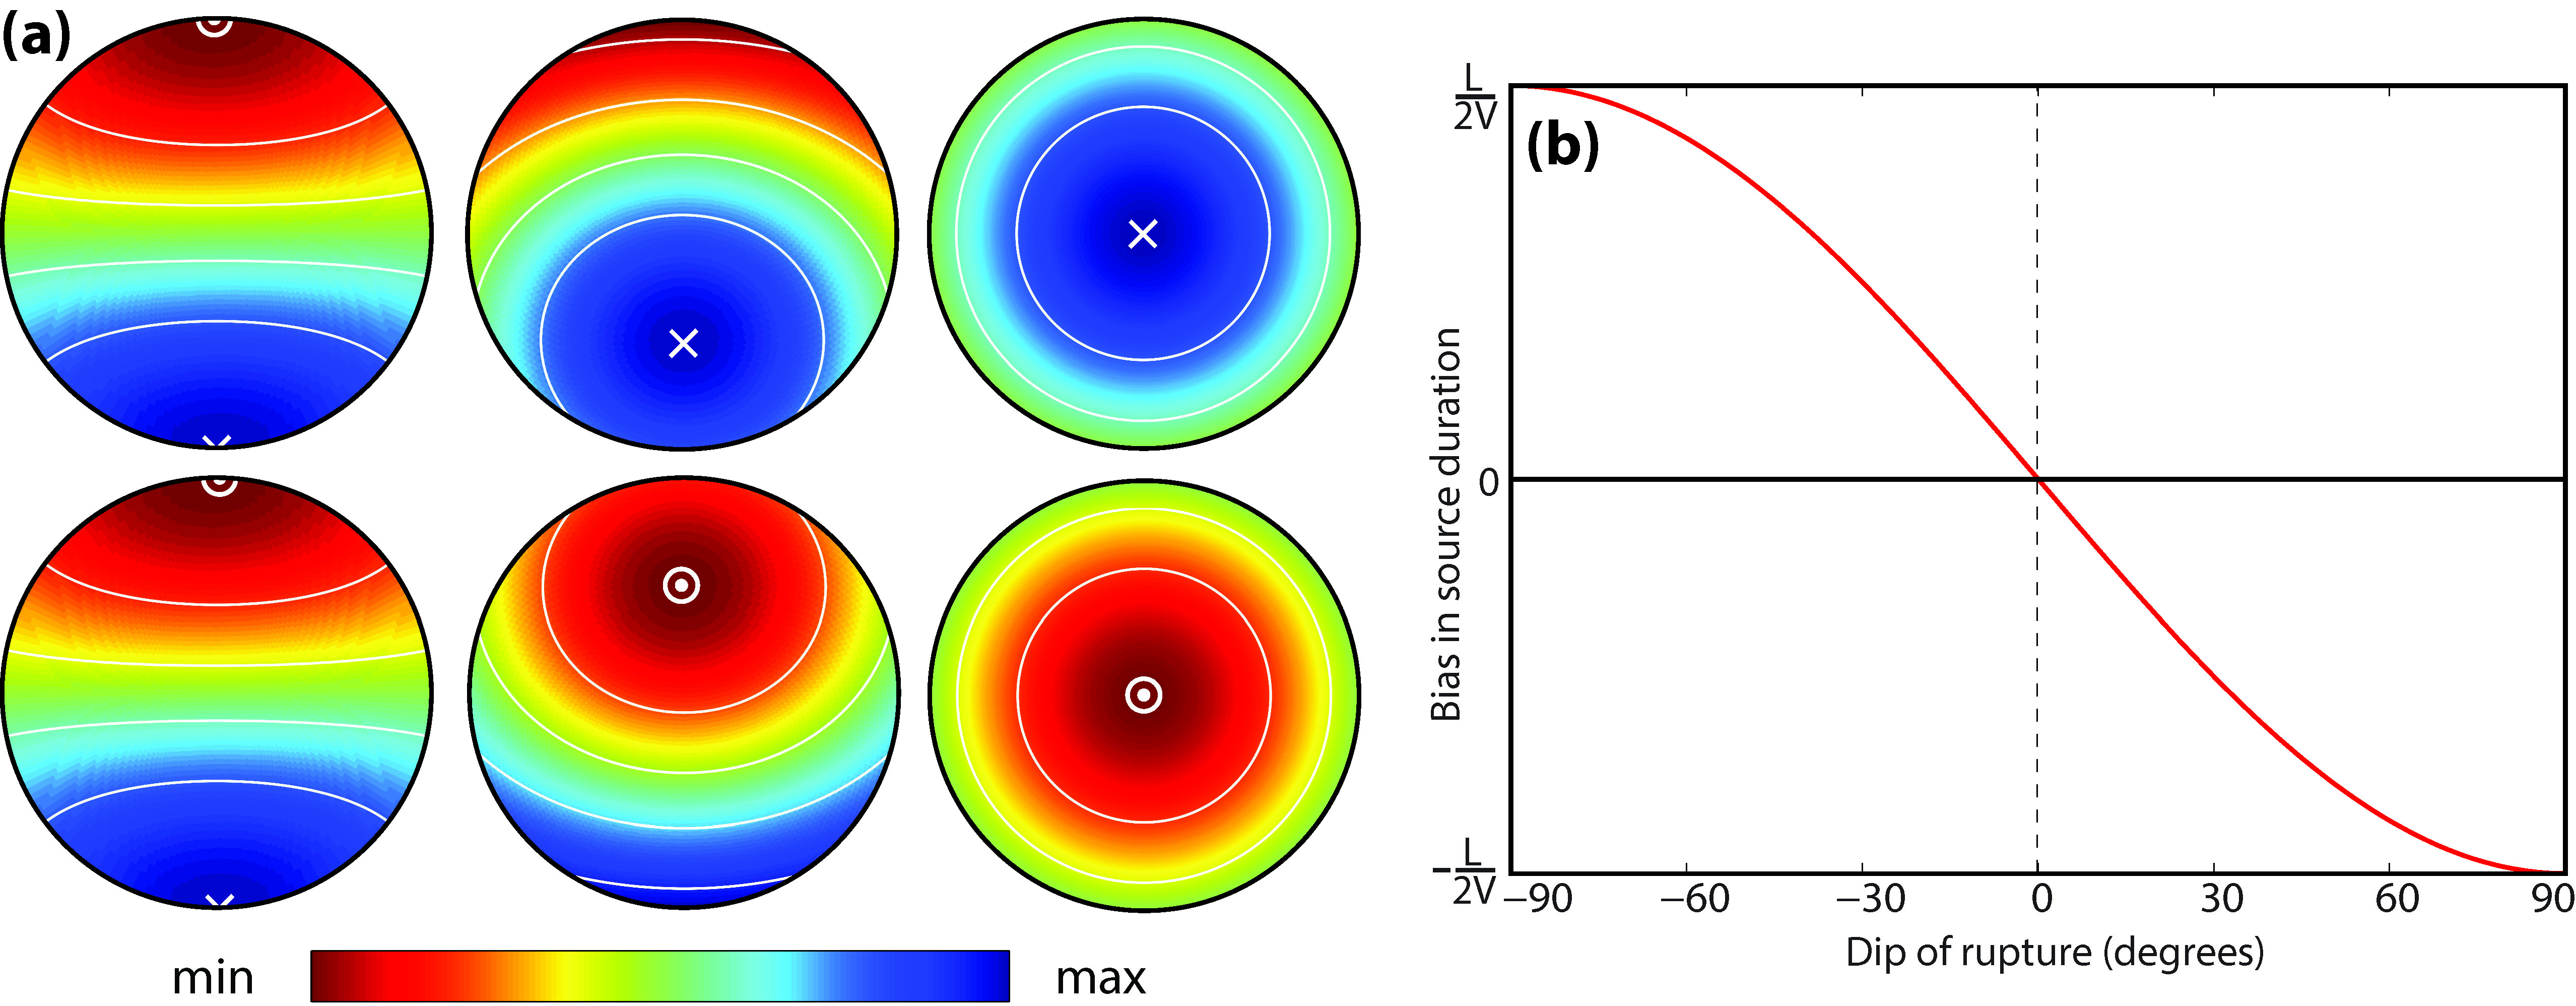
Figure 1:(a) Predicted duration of horizontal (left column), 45°-dipping (middle column), and vertical (right column) ruptures plotted on the upper (top row) and the lower (bottom row) focal hemispheres in the stereographic projection. Strike of the rupture is north. Colours represent the observed duration. White solid lines are contour of the duration at 20% interval, and the arrow head and tail notations in white indicate the rupture direction. Except the horizontal rupture case (0°-dip), using only teleseismic data, i.e., having only lower hemisphere data coverage, can result in biased source duration estimate. (b) Bias resulting from lower-hemispheric data coverage. The difference between the estimated and source duration is shown on the y-axis, where L and V are rupture length and seismic wave speed at the source, respectively.
|
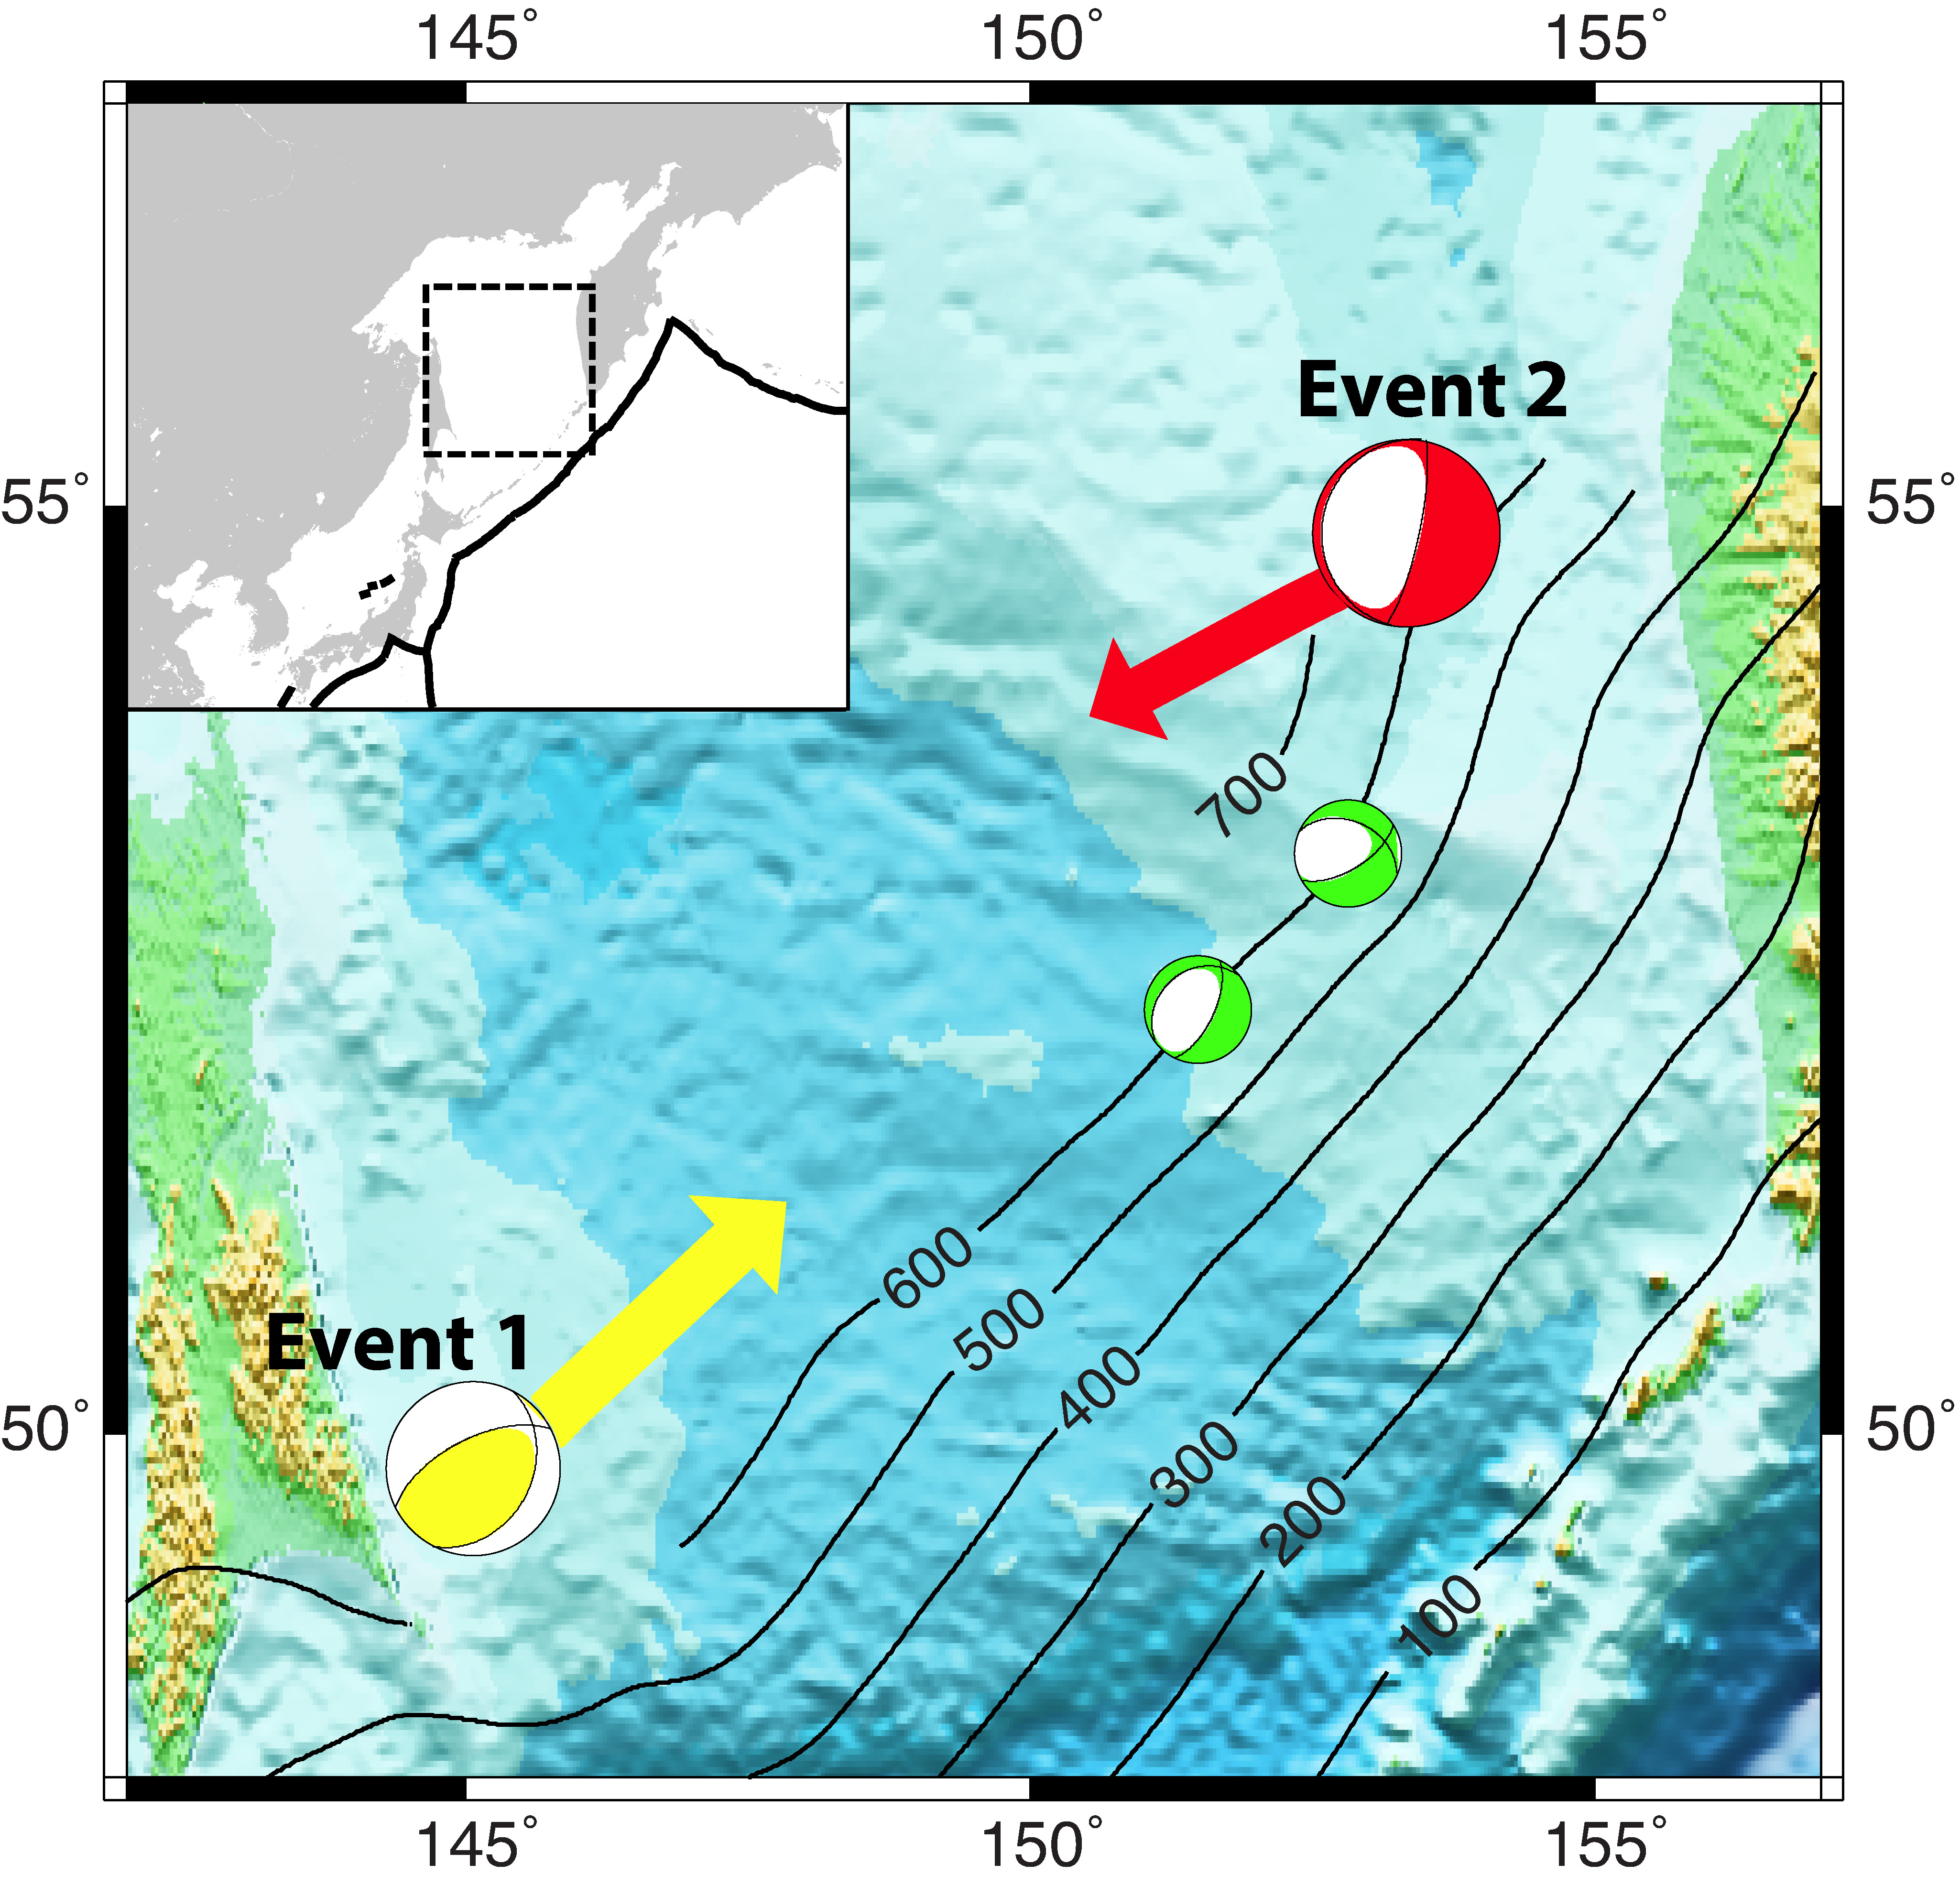
Figure 2: Map view of the event locations and the rupture directions. The epicentral locations of Events 1 (2012 August 14, Mw 7.7) and 2 (2013 May 24, Mw 8.3), and the two major aftershocks of Event 2 shown with yellow, red, and green GCMT mechanisms, respectively. The two aftershocks are both magnitude 6.7, and the southern event occurred on the same day (2013 May 24) as the main shock while the other happened on September 30, 2013. The yellow and red arrows show the horizontal projections of the inferred rupture extent and direction of Events 1 and 2, respectively, with three times amplification in length. The black contour lines with numbers are the slab depth contours of Slab 1.0 model. The background colour shows bathymetry and topography from ETOPO2, and the inset map at the top left shows northeastern Pacific region with the plate boundaries (solid line) and the dashed box corresponding to the area shown in the colour part of the figure. |
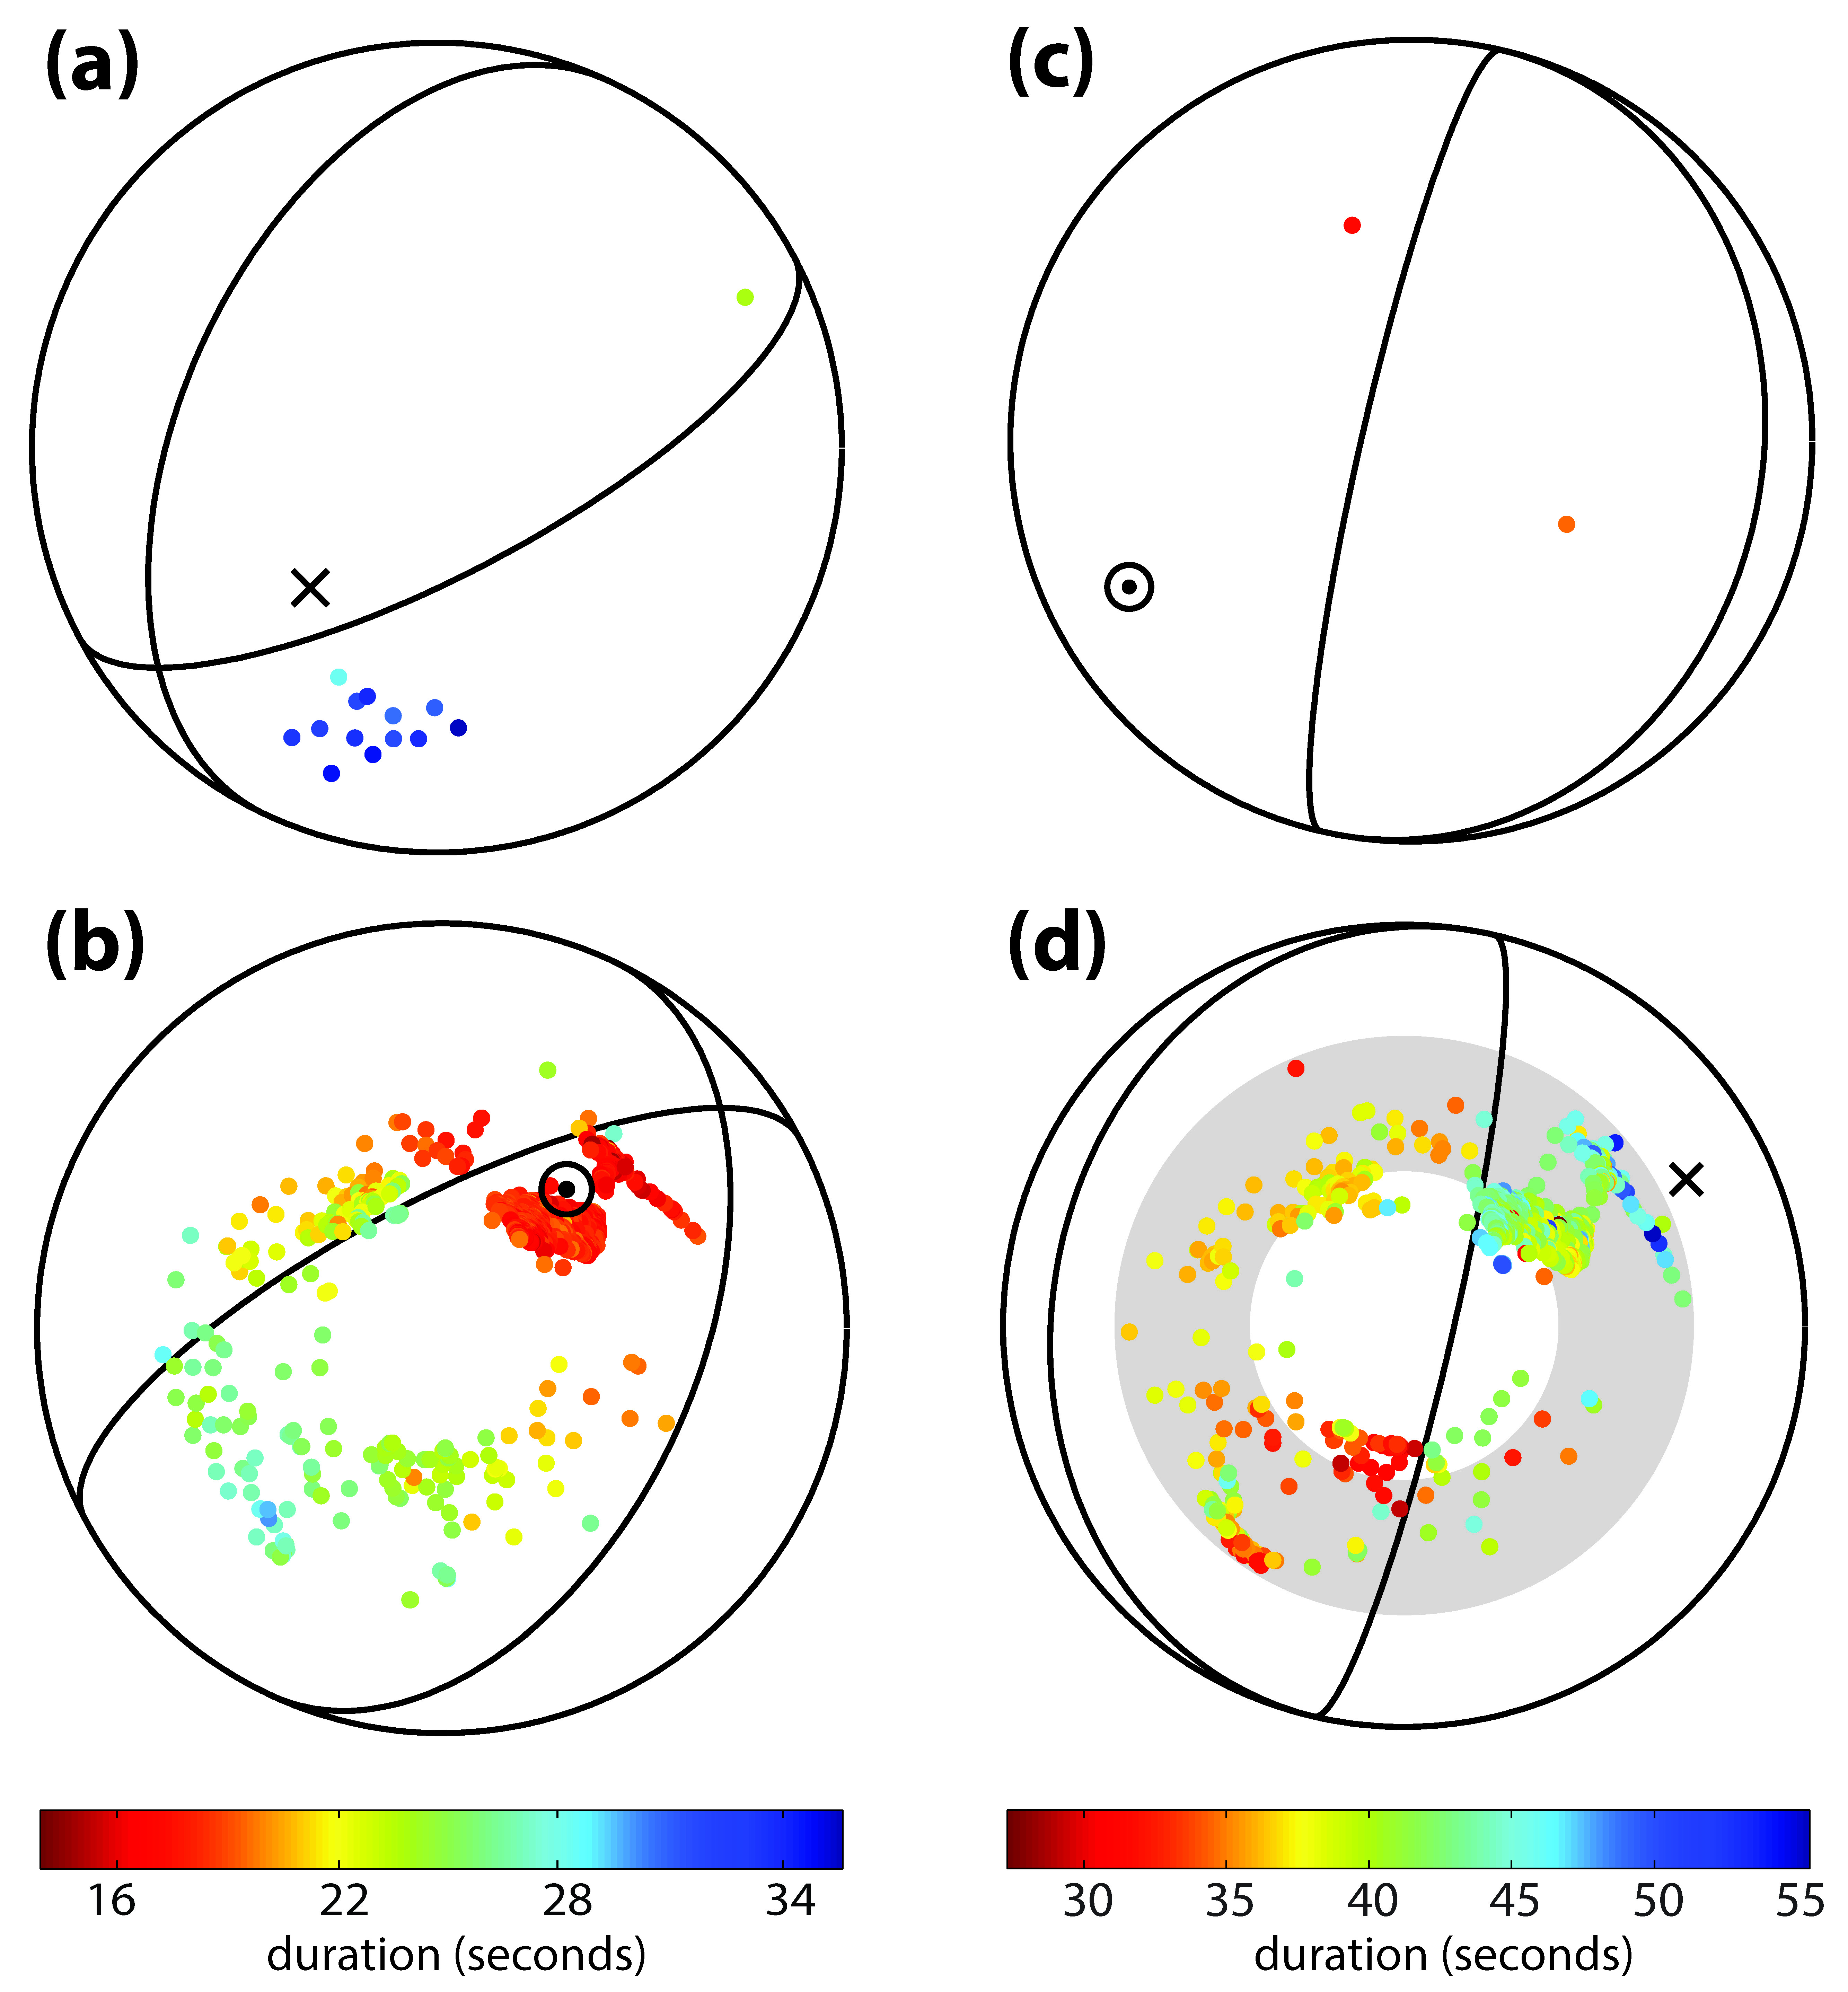
Based upon this framework, we introduce an inversion scheme that uses the duration measurements to obtain four parameters—the source duration, a measure of the rupture extent and speed, and dip and azimuth of the rupture propagation—without any additional assumptions or a priori constraints such as fault plan orientation. The method is applied to two deep-focus events in the Sea of Okhotsk region, an Mw 7.7 event that occurred on August 14, 2012, and an Mw 8.3 event from May 24, 2013 (Figure 2). The source durations are 26±1 and 37±1 seconds, and rupture speeds are 49±4% and 26±3% of shear wave speed, for the Mw 7.7 and 8.3 events, respectively. The azimuths of the two ruptures are parallel to the trench, but are in opposite directions (Figure 2 and 3). The dips of the Mw 7.7 and 8.3 events are constrained to be 48±8° down-dip and 19±8° up-dip, respectively (Figure 3). The fit to the data is significantly poorer for the Mw 8.3 event than the Mw 7.7 event, suggesting that the unilateral rupture may not be a good assumption.
|
Figure 3: Distribution of measured duration for Events 1 and 2. (a) Distribution of measured durations (coloured circles) plotted on the upper hemisphere for Event 1. Nodal planes (solid lines) are from the GCMT solution. The colour of each circle represents the measured duration. The arrow head and tail notation is used to show the inferred rupture direction. (b) Same as (a) except for the lower hemisphere. (c) Same as (a) except for Event 2. (d) Same as (b) except for Event 2. The grey shaded area indicates the range where take-off dip angle is 50±15° which is used in Figure 5(a). |
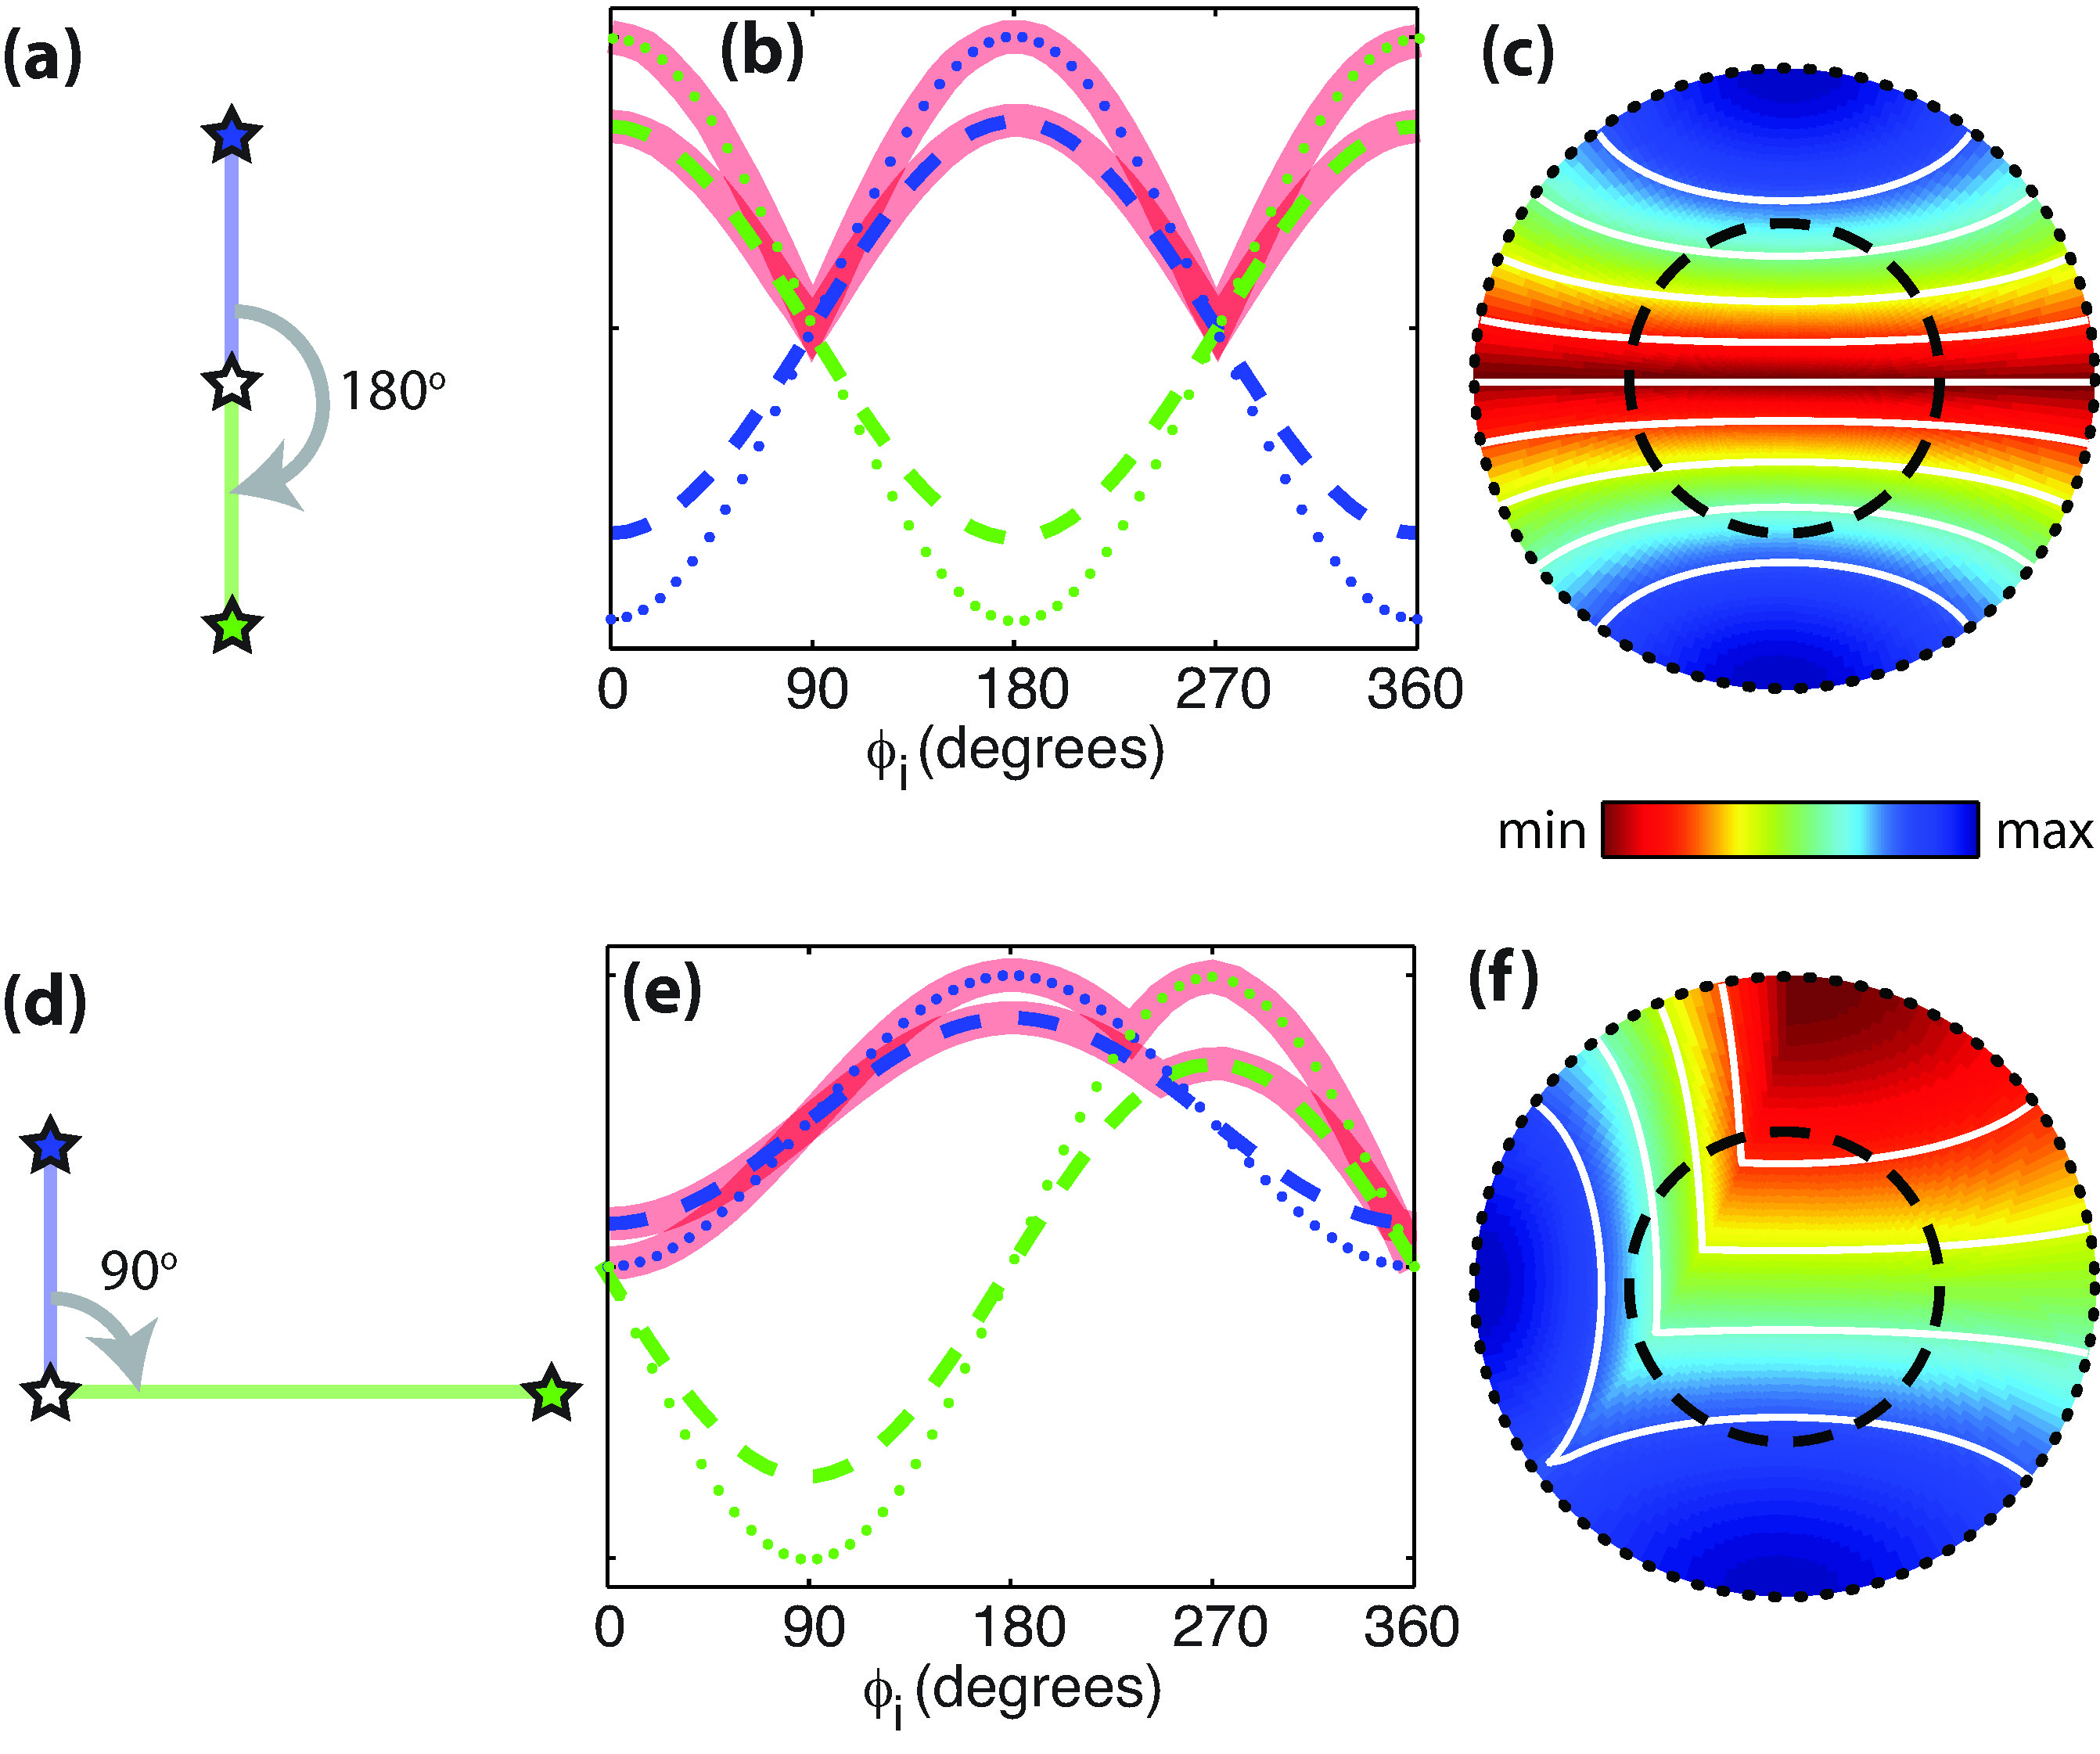
In view of the complexities observed for the Mw 8.3 earthquake, we extend our approach beyond unilateral rupture by replacing the duration equation with a general expression for rupture with multiple episodes in arbitrary directions (Figure 4). This formulation provides insight into some challenges associated with directivity analysis. For example, the shortest observed duration is no longer the direction of rupture, and the assumption of unilateral rupture for a complex earthquake leads to overestimation of the source duration.
|
Figure 4: Examples of duration complexities for non-unilateral ruptures. (a) Depiction of a bilateral rupture on a horizontal plane. The hypothetical rupture starts at the white star (hypocentre), and propagates bilaterally to south (green star, episode 1) and north (blue star, episode 2). The two episodes are at an equal distance from the hypocentre, and occur at the same time. (b) Episode timing (y-axis) as a function of take-off azimuth for the model depicted in (a). The dotted lines are for take-off dip of 0° with colours matching the corresponding episode, and the dashed lines are for take-off dip of ±45°. Thick red curves indicate the end times. (c) Event duration in the focal hemisphere stereographic projection. The pattern for the upper and lower hemispheres are identical. White solid curves are contours of the duration at 20% interval, and the black dotted and dashed circles correspond to the dip angles shown in (b). (d) Same as (a), except that episode 1 (green star) occurs earlier than episode 2 (blue star), and at a distance farther from the hypocentre. (e) Same as (b) except that the lines are for the model shown in (d). (f) Same as (c) except that the plot is for the model shown in (d). |
|
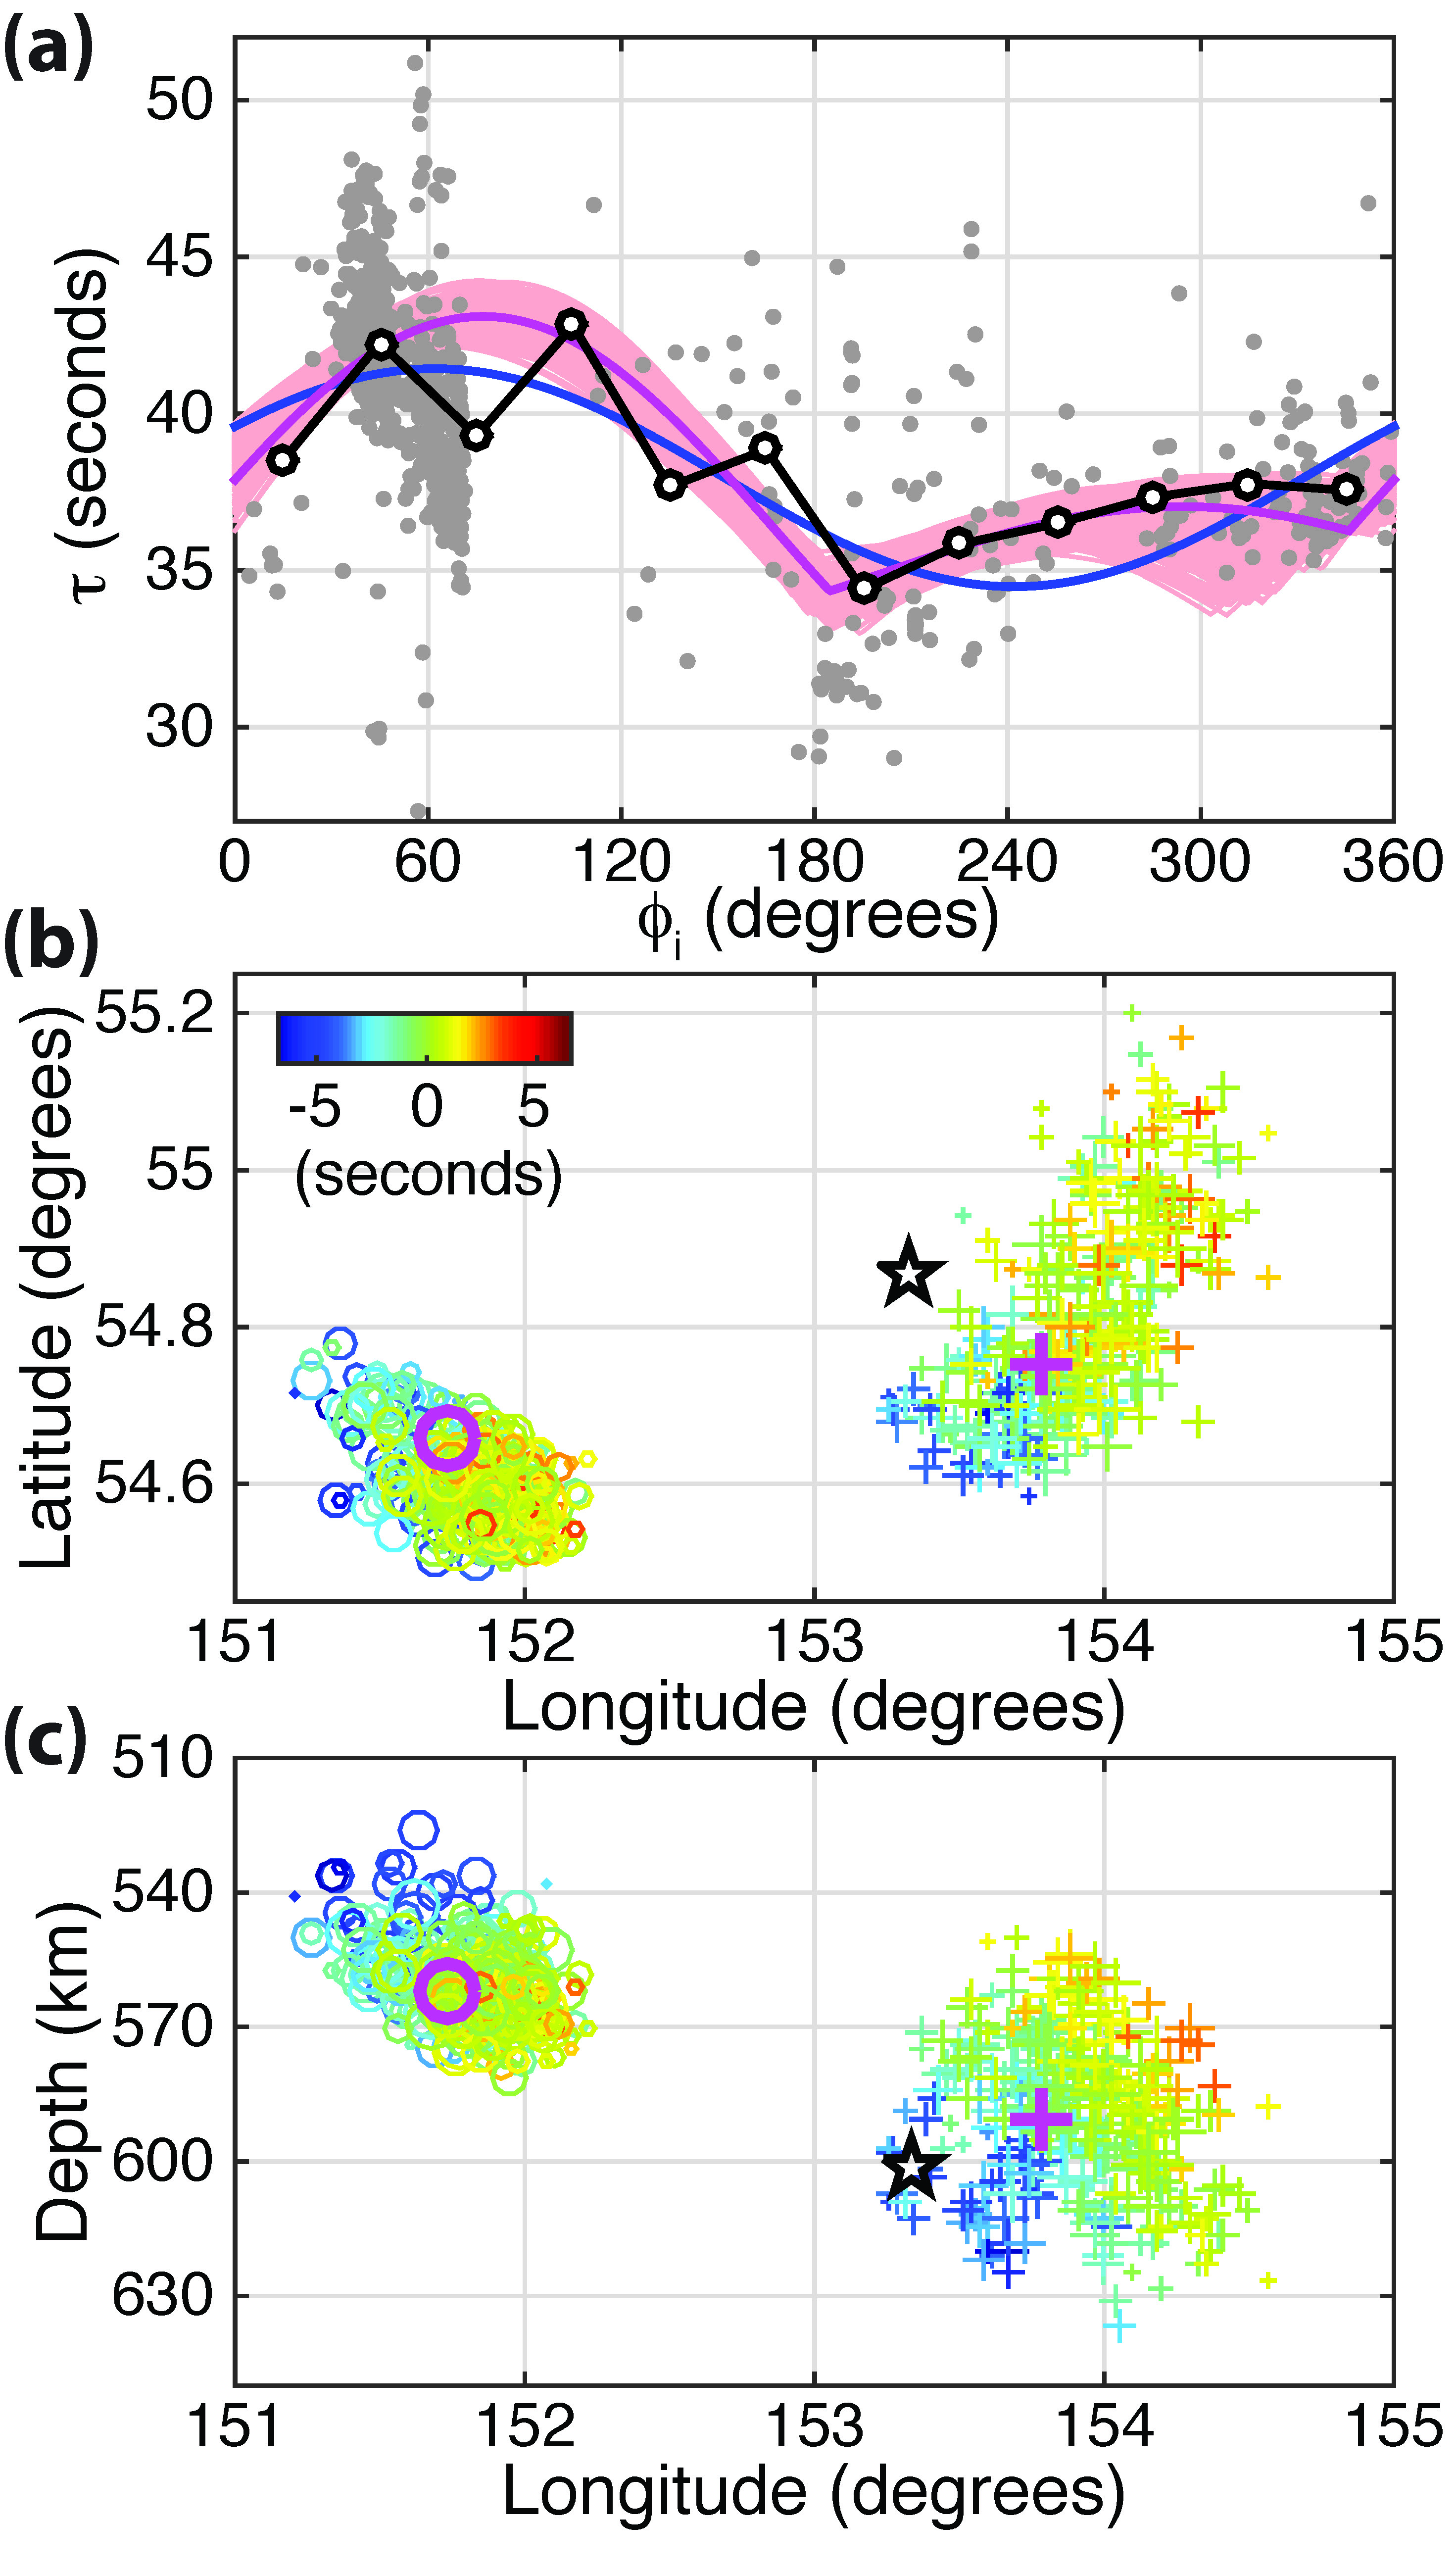
Application of this method using the simulated annealing algorithm results in a two-episode solution that significantly improves the fit to the data (Figure 5a). One cluster of locations is compatible with the location inferred from the unilateral modelling as well as the final subevent identified through back-projection analysis, and the other group of locations is close to some subevent locations in the southeast direction from the back-projection analysis (Figure 5b and c). The source duration estimate obtained from the multi-episode method is about 3 seconds shorter, consistent with the inherent overestimation of the source duration in the unilateral rupture model.
Figure 5: Results of the two-episode analysis of the Mw 8.3 May 24, 2013 earthquake. (a) Measured duration (grey dots) as a function of azimuth for those that have take-off dip angle of 50±15°, i.e., data points within the grey annulus shown in Figure 4(d). White circles with black outline indicate data that have been binned for every 30° in azimuth. These data are compared to predicted durations from the 284 solutions (pink curves) and the best solution (purple curve). The prediction from the unilateral analysis is shown by the blue curve. (b) Epicentral locations of the 284 solutions from the simulated annealing. Clusters A (circles) and B (crosses) are coloured by the relative timing of the pair of episodes and the sizes of the symbols are proportional to the fit to the data with larger symbols indicating better fit. Purple circle and cross show the position of the best solution. The NEIC hypocentral location for the event is shown by the star. (c) Same as in (b) except that the solutions are shown in the depth-longitude space. |
|
Publications
Park, S., Ishii, M., 2015, Inversion for rupture properties based upon 3-D directivity effect and application to deep earthquakes in the Sea of Okhotsk region, Geophysical Journal International, 203, 1011-1025, doi: 10.1093/gji/ggv352.