Revisiting Seismic Tomography through Sparse Direct Methods and High Performance Computing
Point of contact: Petros Bogiatzis
Over the last decade rapid increase in data availability with the introduction of dense networks such as the EarthScope USArray project (e.g., Burdick et al., 2012) and Hi-net in Japan (Okada et al., 2004) allowed utilization of a large number of observations and denser model parameterizations, yielding massive tomographic problems with model spaces of the order of 105-106. Despite the advantages in theory, methodology and computational power, a crucial aspect remains unaddressed i.e., the quantitative assessment of the uncertainty of the tomographic models. This issue becomes increasingly challenging, even intractable, as the size of the tomographic problem expands. Consequently, a paradoxical situation arises. Although modern tomographic studies with large amount of data and model parameters produce potentially better images, these improvements cannot be accurately assessed or confirmed. This makes identification of poorly-resolved regions and spurious features difficult, and they may be interpreted for something that does not exist in the real Earth.
In this project, we revisit the application of direct methods in solving tomographic inverse problems in view of significant developments in computer science and hardware in the last decade. For example, efficient rank-revealing algorithms that takes advantage of new architectures such as memory hierarchy and parallelism now exist. Furthermore, new fill-reducing ordering algorithms effectively propagate sparsity throughout common factorizations (Figure 1; e.g., Karypis and Kumar, 1998; Davis et al., 2004a, 2004b; Amestoy et al., 2004])
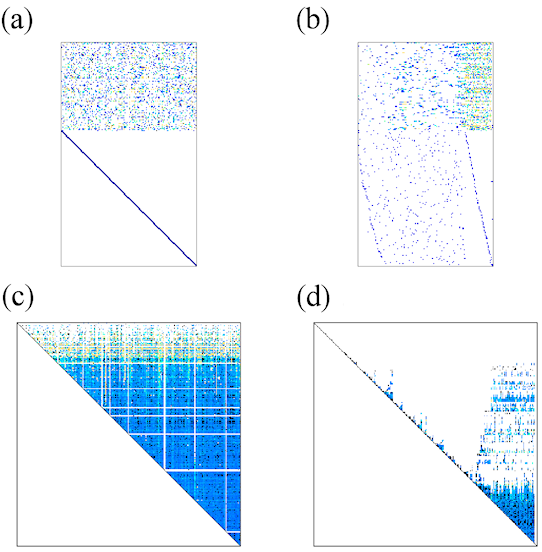
Figure 1: (a) Initial example matrix that contains 0.9% of non-zero elements. The colors show the size of the entries with white being zero and dark blue colors indicating large values. (b) The same matrix with different ordering of its columns. (c) The upper triangular factor R, of QR-factorization. (d) The R factor of the perturbed version of the matrix shown in (b).
We employ a modern, direct, sparse solver based upon QR factorization (SuiteSparse 4.4.0; Davis, 2011) to demonstrate that it can be used to solve, and accurately compute, the full resolution matrix of a large problem. For this exercise, we employ the teleseismic data set from CREST (Colorado Rockies Experiment and Seismic Transets; Aster et al., 2009; MacCarthy, 2010). This is the same data set used by MacCarthy et al. (2011) to retrieve estimates of the diagonal elements of the resolution matrix using matrix probing techniques, and provides a comparison basis. The model space is parameterized in the same manner as in MacCarthy et al. [2001] using 267,520 constant velocity blocks. A map with the region and the stations used is shown in Figure 2
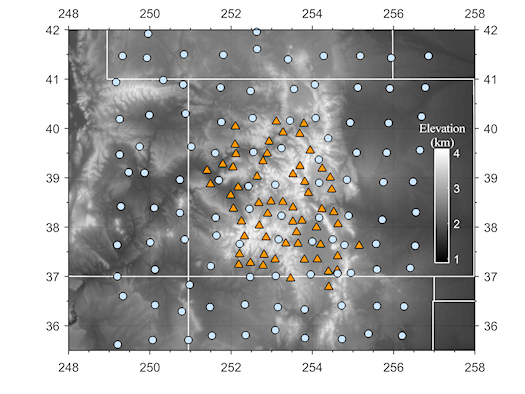 |
Figure 2: Map of stations from the teleseismic tomography experiment of MacCarthy et al. (2011). CREST stations are shown as orange triangles, and USArray stations are shown as blue circles. The background elevation is given in gray scale (Amante & Eakins 2009). |
All computations are performed in one node at Harvard’s Odyssey Cluster, using 32 CPU cores, and total shared memory of about 250 GB. The forward operator was successfully factorized. The R factor has only 2.2% non-zeros, using the ordering inferred by METIS algorithm (METIS 4.0.1; Karypis & Kumar 1998) (Figure 3a). Next, the posterior model resolution matrix was computed (Figure 3b). This matrix of size 267,520×267,520 contains ~40% non-zeros, requiring over 200GB of storage space in double precision. Reduction in storage can be achieved by eliminating tiny entries. For example, by eliminating entries with absolute values less than 1e-3, the non-zeros drop to ~0.5% and the required storage to about 3GB.
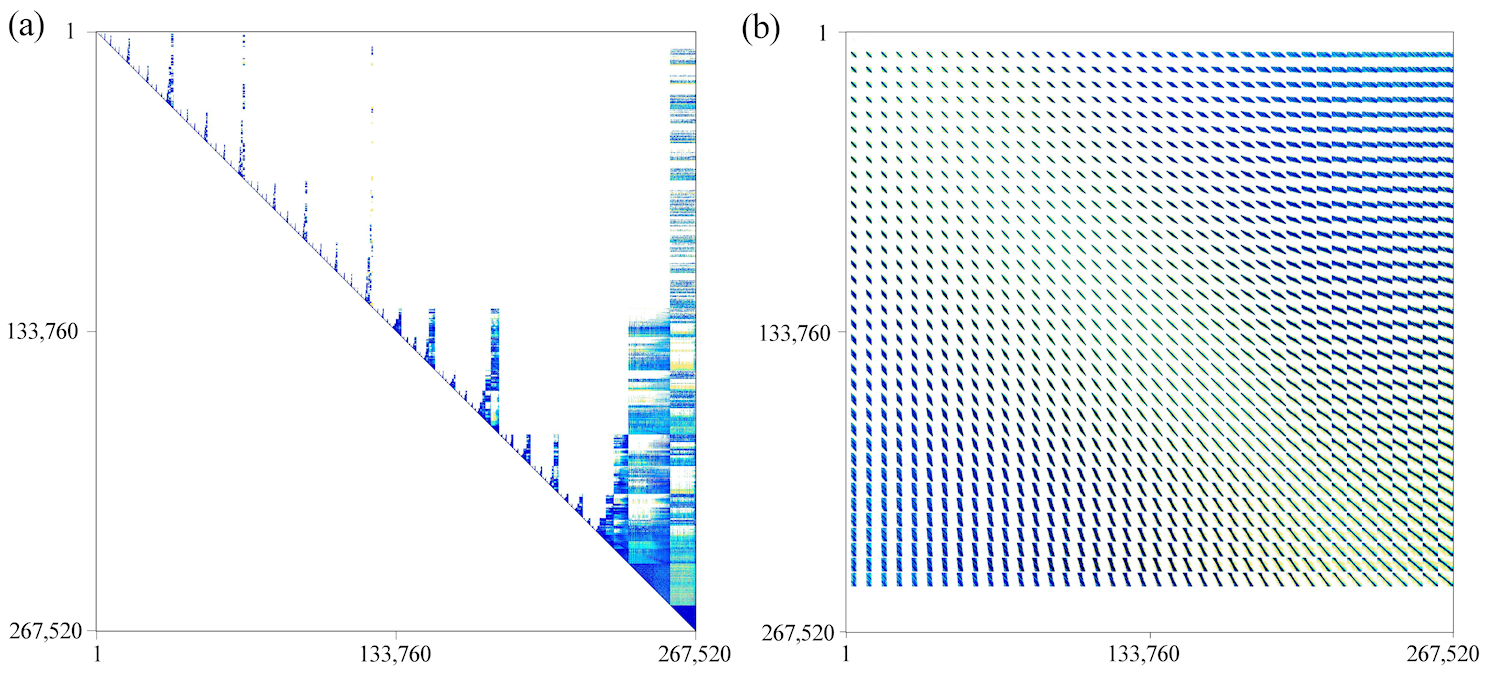
Figure 3: (a) Sparseness structure of the R factor from QR decomposition. Zero elements are colored white while darker colors represent larger absolute values. (b) The full resolution matrix. The color scheme is same as (a) except that white color includes all entries with absolute value smaller than 0.001.
The availability of the full resolution matrix (i.e., diagonal and off-diagonal elements) allows the evaluation of the trade-off between model parameters. This can be visualized by plotting the specific rows of the resolution matrix (Figure 3).
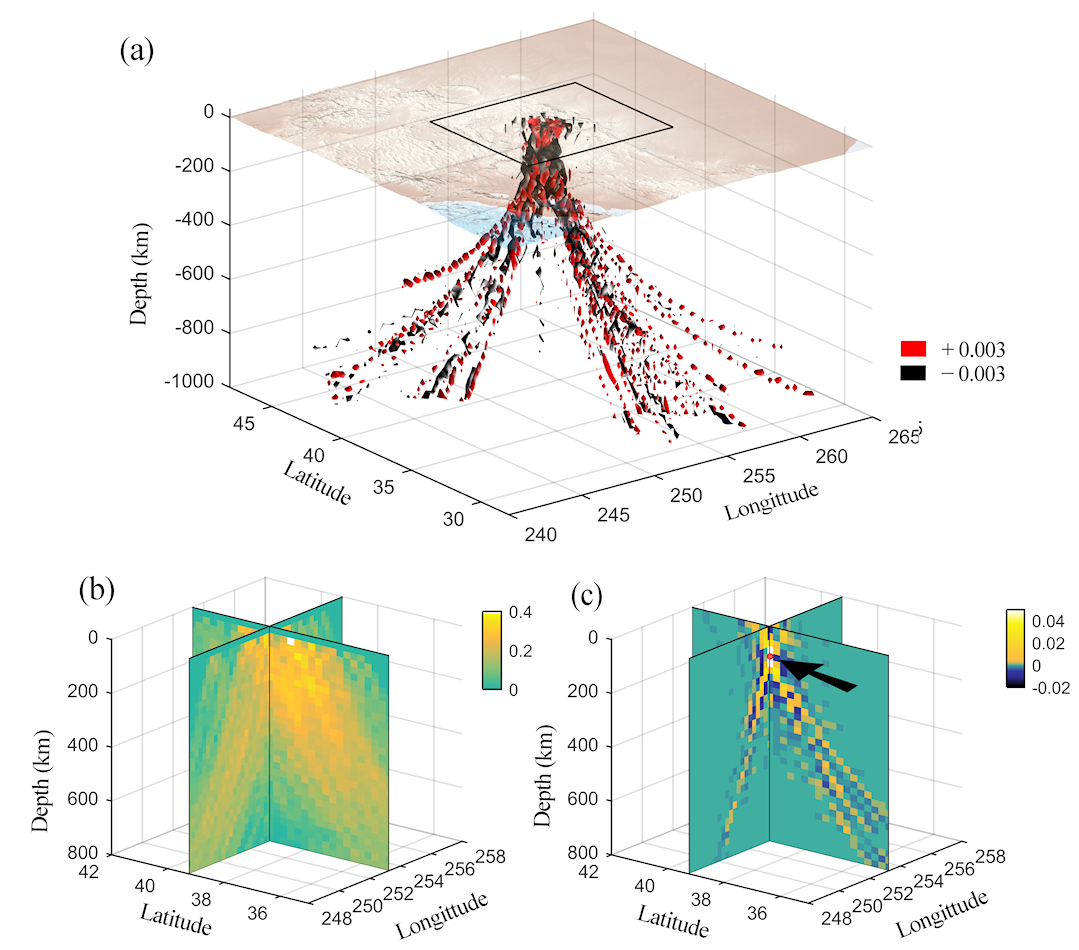
Figure 4: (a) Three-dimensional visualization of the 30,136th row of the resolution matrix, showing the isosurfaces at 0.003 (red) and -0.003 (black). In the topographic map, the rectangle with the thick gray border shows the region of the model displayed in (b) and (c) corresponding to the region interpreted by MacCarthy (2010) and MacCarthy et al. (2011). (b) Cross sections of the diagonal elements of the resolution matrix for the gray-boxed region in (a) and to a depth of 800 km. (c) Similar to (b) but for the 30,136th row of the resolution matrix. The location of the corresponding model parameter is shown by the red circle at the depth of ~100 km emphasized by the black arrow.
ReferencesSome aspects of this research are going to be presented in the 2015 AGU fall meeting:
Talk S13C-01, Revisiting Seismic Tomography Through Direct Methods and High Performance Computing
by Miaki Ishii*, Petros Bogiatzis and Timothy A. Davis.
Monday, 14 December 2015, 13:40 - 13:55 Moscone South - 307
- Amestoy, P.R., Davis, T.A. & Duff, I.S., 2004. Algorithm 837: AMD, an approximate minimum degree ordering algorithm, ACM Trans. Math. Softw., 30(3), 381--388.
- Aster, R., MacCarthy, J., Heizler, M., Kelley, S., Karlstrom, K., Crossey, L., Dueker, K. & the CREST Team, 2009. CREST experiment probes the roots and geologic history of the Colorado Rockies, Outcrop., 58(1), 6--21.
- Burdick, S., van der Hilst, R.D., Vernon, F.L., Martynov, V., Cox, T., Eakins, J., Karasu, G.H., Tylell, J., Astiz, L. & Pavlis, G.L., 2012. Model Update March 2011; Upper mantle heterogeneity beneath North America from traveltime tomography with global and USArray transportable array data, Seism. Res. Lett., 83(1) 23--28
- Davis, T.A., 2011. Algorithm 915, SuiteSparseQR: Multifrontal multithreaded rank-revealing sparse QR factorization, ACM Trans. Math. Softw. 38 (1), 8:1--8:22.
- Davis, T.A., Gilbert, J.R., Larimore, S.I. & Ng, E.G., 2004a. Algorithm 836: COLAMD, A column approximate minimum degree ordering algorithm, ACM Trans. Math. Softw., 30 (3), 377--380.
- Davis, T.A., Gilbert, J.R., Larimore, S.I. & Ng, E.G., 2004b. A column approximate minimum degree ordering algorithm, ACM Trans. Math. Softw., 30 (3), 353--376.
- Karypis, G. & Kumar, V., 1998. A fast and high quality multilevel scheme for partitioning irregular graphs, SIAM J. Sci. Comput., 20, 359--392.
- MacCarthy, J., 2010., The structure of the lithosphere beneath the Colorado Rocky mountains and support for high elevations, Ph.D. thesis, N.M. Inst. of Min. and Technol., Socorro.
- MacCarthy, J.K., Brochers, B. & Aster, R.C., 2011. Efficient stochastic estimation of the model resolution matrix diagonal and generalised cross-validation for large geophysical inverse problems, J. Geophys. Res., 116, doi: 10.1029/2011JB008234.
- Okada, Y., Kasahara, K., Hori, S., Obara, K., Sekiguchi, S., Fujiwara, H. & Yamamoto A., 2004. Recent progress of seismic observation networks in Japan - Hi-net, F-net, K-NET and KiK-net, Earth Planets Space, 56(8), 15--28.