
|
DigitSeis: A Digitization Software for Analog Seismograms
Point of contact: Miaki Ishii |
DigitSeis is a software written in MATLAB that converts digital, raster images of analog seismograms to readily usable, discretized time series using image processing algorithms.
DigitSeis v1.3 Download (March 19, 2018)
- Package for Non-MATLAB Mac Users (includes Manual, DigitSeis v1.3, Example Image, 850 MB)
- Package for MATLAB Users (includes Manual, DigitSeis v1.3, Example Image)
For access to individual DigitSeis component files (e.g., manual) and older versions of DigitSeis, go to DigitSeis Downloads.
Description
An analog seismogram is typically subject to various distortions. For example the spiral way of recording around a rotating drum, also known as helicorder drum causes a quadratic distortion (Figure 1a). Additionally, storage conditions, scanning or photo shooting process further distort the seismogram and consequently the final raster image with (e.g., Figure 1b). Such distortions that often cannot be handled deterministically (i.e., by fitting a mathematic distortion model), may deteriorate the digitization and the timing of the traces. DigitSeis automatically identifies and corrects for various geometrical distortions of seismogram images.
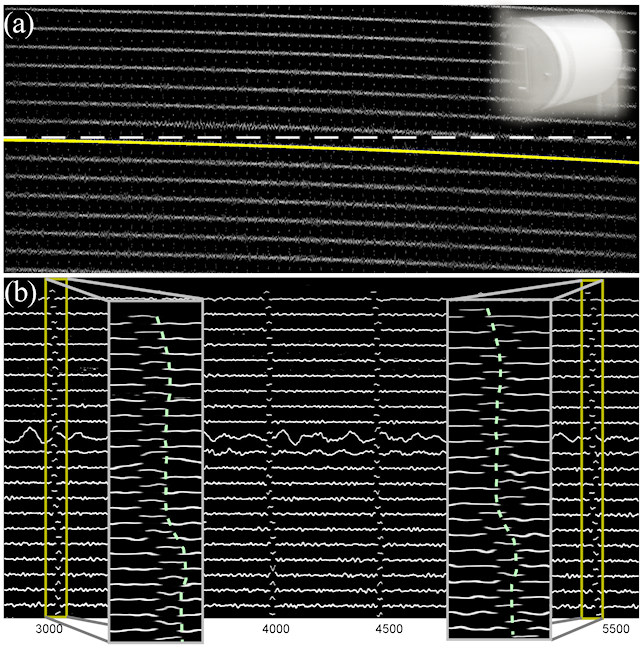
Figure 1: Example of various distortions that exist in seismogram images. (a) Helicorder distortion along the traces. The solid line in the middle of the image represents the second-degree polynomial that fits the observed distortion. (b) Distortion along the time marks showing horizontal stretching or shrinkage. The two insets show zoom in around two vertical strips, and the dashed lines are identical in both windows, drawn to follow the position of the time marks in the left strip.
With human supervision, DigitSeis identifies and classifies the different features of the seismogram such as time marks, main trace and noise such as stains and handmade notes (e.g., Figure 2).
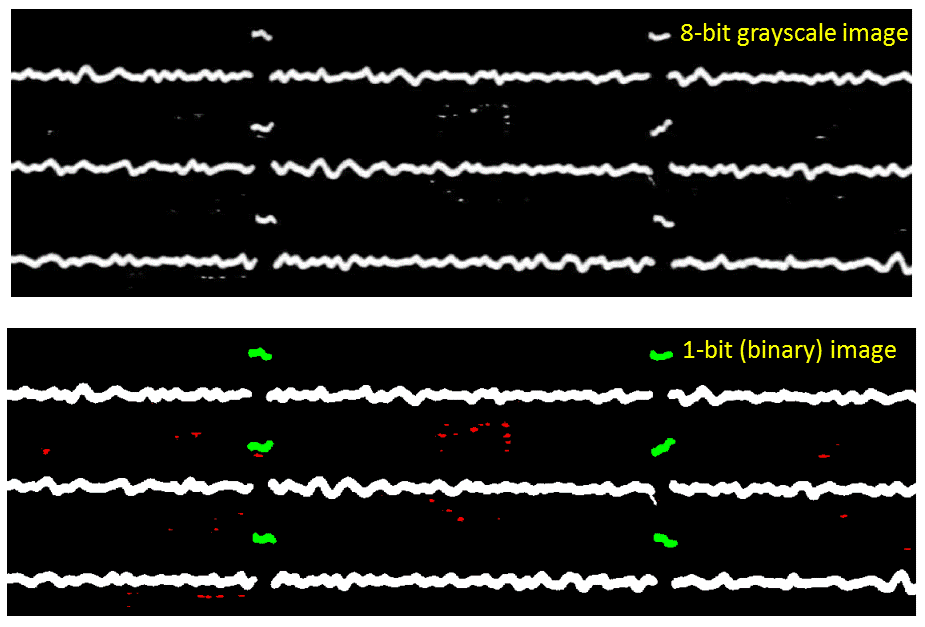
Figure 2: An example of classification of traces into three categories, main traces (white), time marks (green) and noise (red).
DigitSeis uses the classification result to digitize both the traces and the time marks, by using the intensity information (Figure 3). Although a large effort has been made to minimize the human input, DigitSeis provides interactive tools to deal with challenging situations such as trace crossings and stains in the paper.
Figure 3: Demonstration of the digitization process.
One of the advantages of DigitSeis is that it corrects time-mark offsets from the main trace to produce continuous seismograms (Figure 4). Furthermore it uses the locations of the time marks to accurately time the traces.
 |
Figure 4: This animation demonstrates the reasoning based upon DigitSeis corrects for the time marks off-set. At the top is shown the digitization result for various relative positions between the normal trace and offset. At the bottom is shown the corresponding mean amplitude of the first derivative of the digitized trace. |
DigitSeis Downloads
- DigitSeis v1.3 (March 19, 2018)
- Bundles
- Package for Non-MATLAB Mac Users (includes Manual, DigitSeis v1.3, Example Image, 850 MB)
- Package for MATLAB Users (includes Manual, DigitSeis v1.3, Example Image)
- Individual Files
- Manual (pdf file, 30 MB)
- DigitSeis v1.3 Package for Non-MATLAB Mac Users (zip file, 800 MB)
- DigitSeis v1.3 App Installer for MATLAB Users
- Example Image (JPEG file, use right mouse button to download, 60 MB)
- Bundles
- DigitSeis v1.1 (June 01, 2017)
- Download DigitSeis v0.53 with its user manual (zip file, ~3 MB)
Reference
If you use DigitSeis, please refer to the following publication.- Bogiatzis, P, & Ishii, M., 2016.
DigitSeis: A new digitization software for analog seismograms.
Seismological Research Letters 87(3), 726-736.
Acknowledgment
This project was partially supported by the U.S. Geological Survey Earthquake Hazard Program G14AP00016, G16AP00021, G17AP00007, and G18AP00018 as well as by the Miller Institute for Basic Research in Science at University of California, Berkeley.